Introduction
In archeology, art history and art repairing, it is generally very important to know and analyze what kind of paint materials our ancestors had used historically. Raman spectroscopy is a very useful non-destructive analytical tool for evaluating archaeological ruins and works of art. In addition, since its measurement range is much wider than IR spectroscopy, it enables to measure the organic pigment as well as inorganic pigment that has absorption peaks in low wavenumber range below 400 cm-1 1).

In general, it is difficult to obtain good Raman spectrum of the material which has fluorescent characteristic (such as pigment). In this case, since these materials have strong and sharp absorption peaks in visible region, it is expected to avoid the fluorescence emission effect by selecting the excitation wavelength that is far from the absorption band.
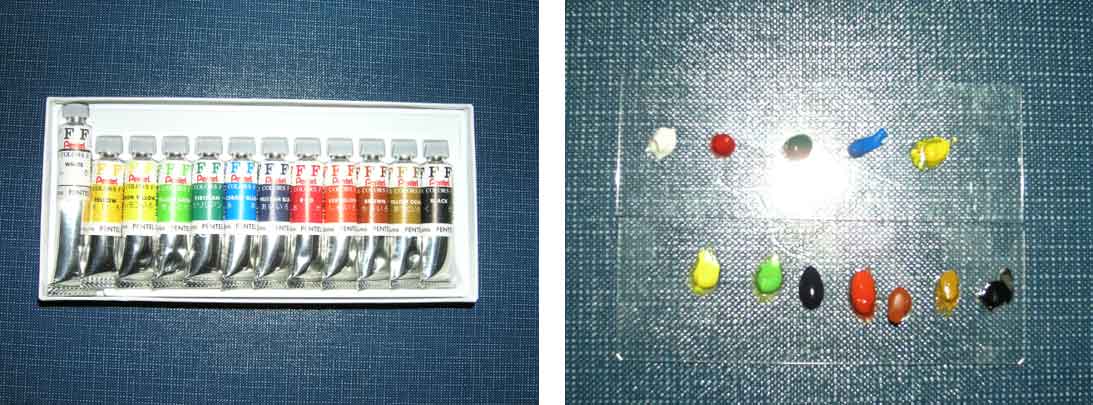
In this experiment, 12 different aqueous paints were used as test samples, which were excited by 3 different wavelengths lasers.
Experimental
Measurement condition
Samples: 12 different aqueous paints
Objective lens: x20
Excitation wavelength: 532 nm, 633nm and 785 nm
Results
Figure 1 shows the spectral data obtained in this experiment.
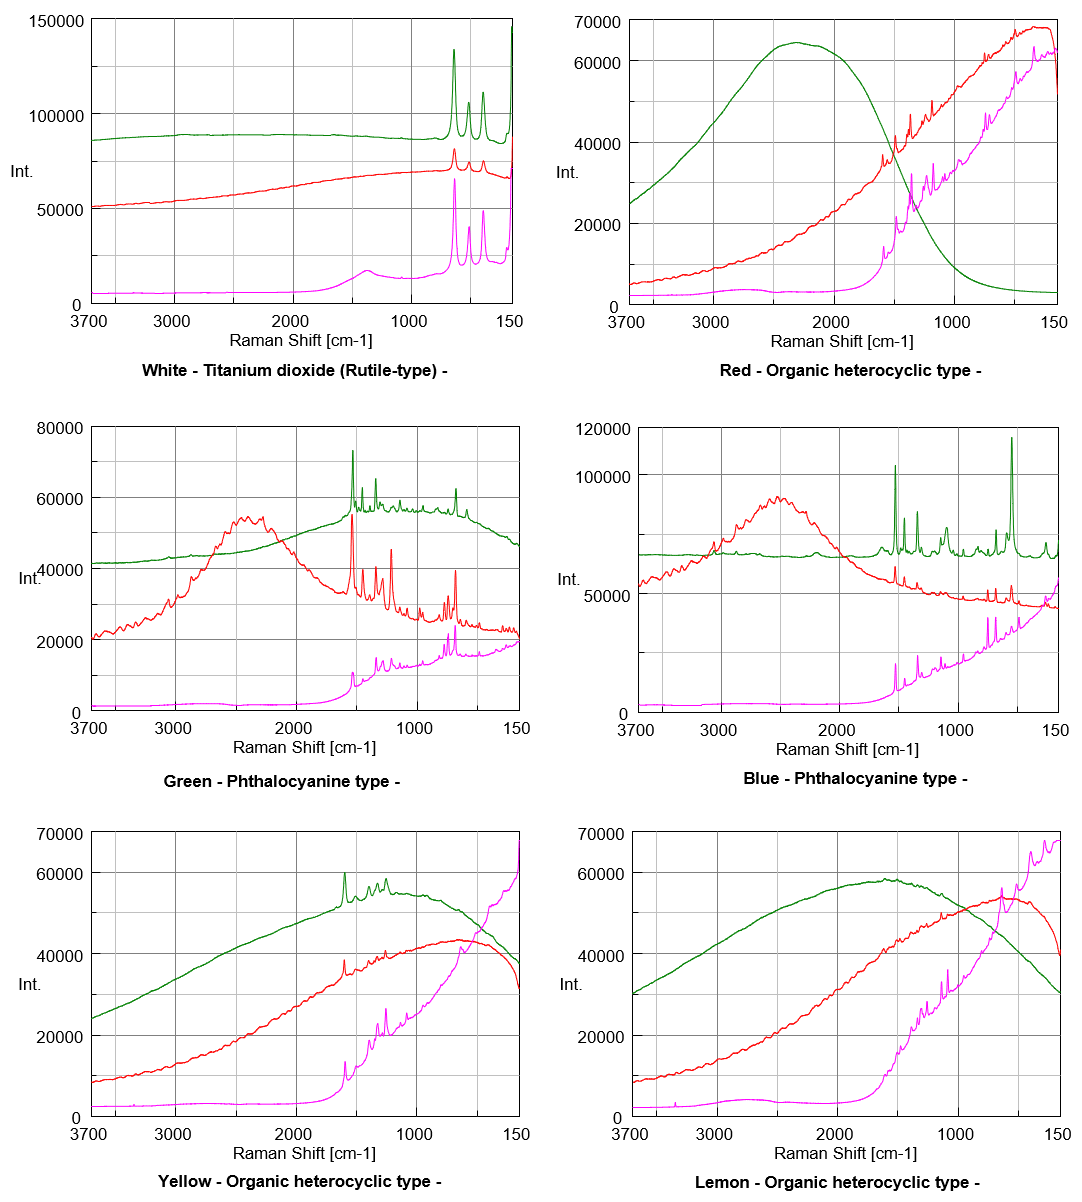
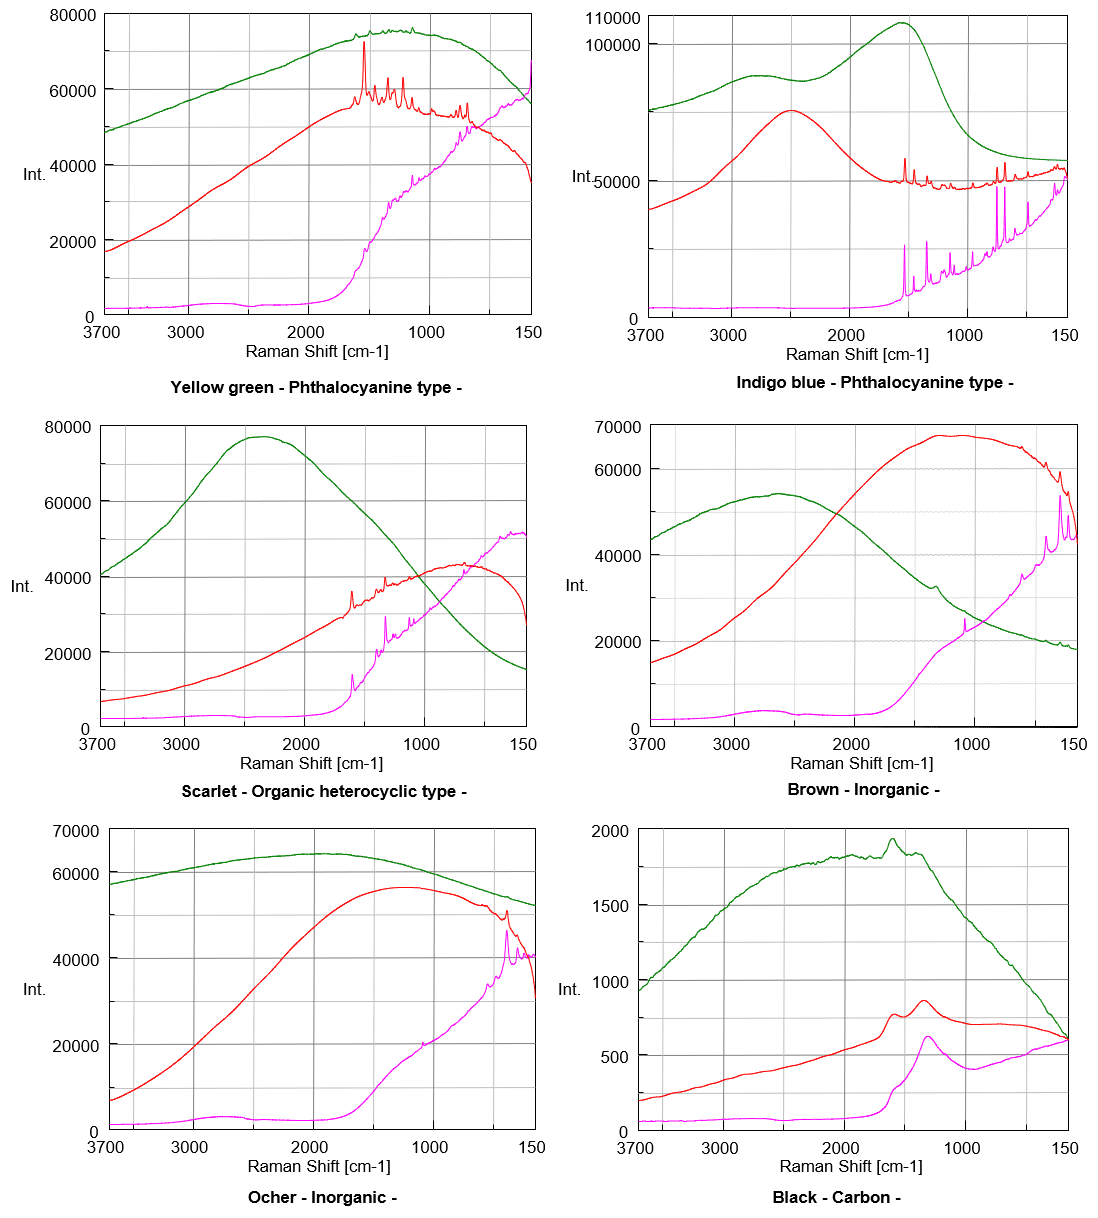
As the result, Raman spectra of White, Yellow and Black pigment samples show the similar level S/N even excited by any of 3 different excitation wavelength. Spectra of Red, Lemon, Indigo blue, Scarlet, Brown and Ocher pigment samples show better S/N when excited by longer wavelength such as 785 nm. On the other hands, the better spectrum of Blue pigment sample was obtained when excited by the shorter wavelength such as 532 nm, and also good spectra of Green and Yellow pigment samples were obtained under the excitation wavelength in 633 nm. Generally, the color is recognized as the complementary color of absorbed light (Figure 2). As an example, Red pigment sample irradiates as strong fluorescence under the excitation wavelength in 532 nm because it absorbs the light selectively between green and blue region.
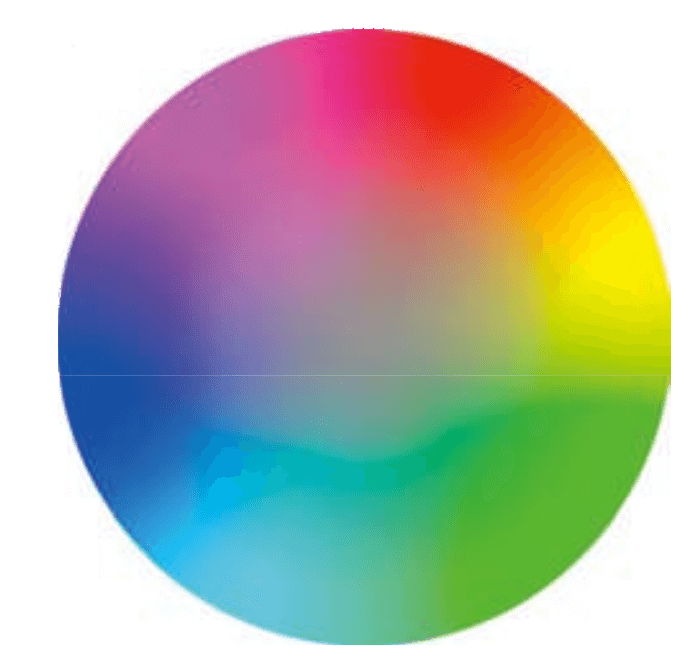
Figure 2. Wheel of hue
However, the Green pigment sample which is expected to absorb Red light has actually shown the best S/N condition under the excitation wavelength in 633 nm which is in Red region. This phenomenon can be considered to occur because Raman peak of Phthalocyanine compound (Figure 3) as the component of Green pigment sample is enhanced selectively by Red laser due to Resonance Raman effect.
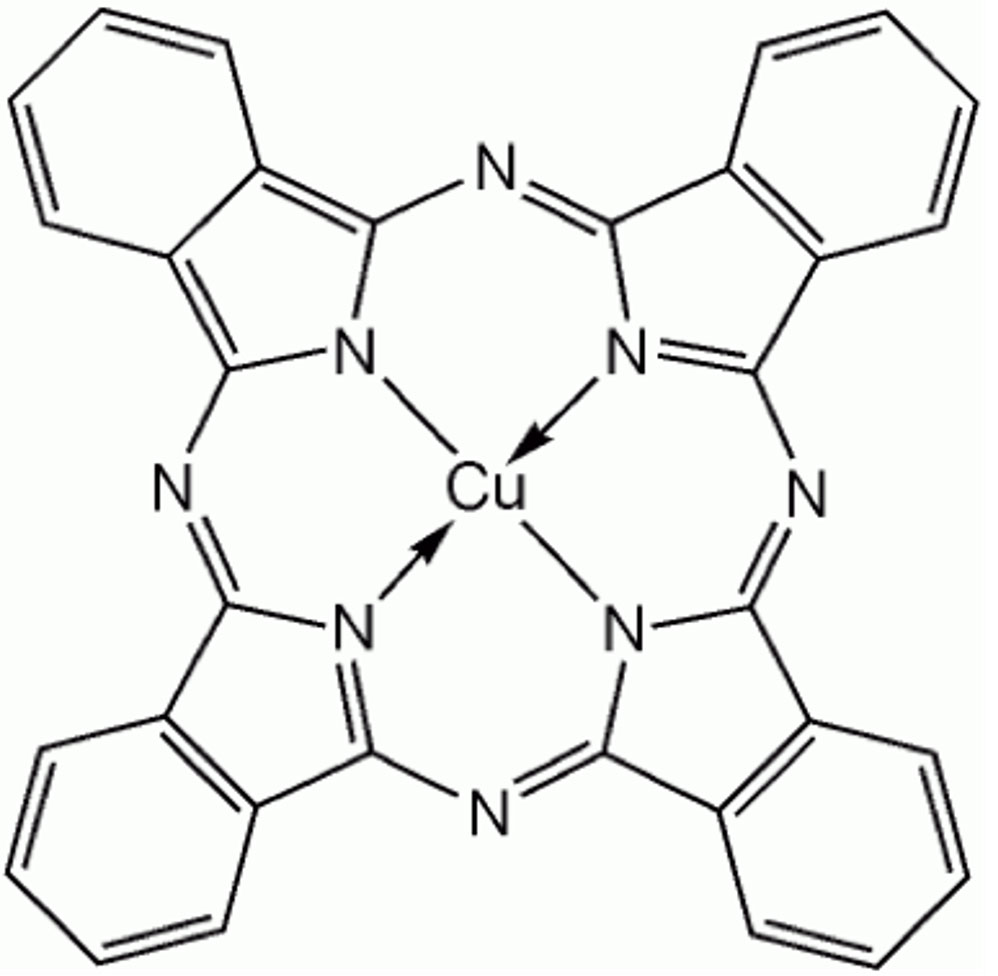
Figure 3. Phthalocyanine complex
In addition, the shapes of spectra of Green, Blue and Indigo Blue samples depend on the excitation wavelength, which can be considered that the group vibration of Chromophore derived from absorption is enhanced selectively due to Resonance Raman effect. As well as Phthalocyanine, Chlorophyll and Hemoglobin which have similar chemical structure to Phthalocyanine are known as typical compounds that have Resonance Raman effect characteristics depending on excitation wavelength. Regarding the spectra of organic pigment which obtained in this experience, they could not be identified completely by the spectral search, because the ratio of peak intensity depends on the excitation wavelength, and pigment components contain various crystal polymorph (physical characteristics such as hue and anti-corrosion depend on the type of crystal polymorph).
Conclusion
As shown in the above, Raman spectroscopy is the very useful analysis tool for pigment analysis as well as the evaluations of crystal polymorph and patent application for the cutting edge materials (such as the luminescence material of Organic EL, absorbing pigment of Blue-Ray disk, and functional pigment as photovoltaic materials of Dye Sensitized Solar Cell).
References
(1) P. Perugino, Journal of Cultural Heritage, Vol. 8, Issue 1, January-March 2007, Page 65-68


