Introduction
The test of color in Hazen units using an ultraviolet-visible spectrophotometer is specified by JIS K 0071-2: 2017, ISO 6271: 2015 and ASTM D 1209: 2005. This Hazen color test evaluates the degree of coloration of liquid chemicals used as raw materials, such as drying oils, varnishes and petroleum, and chemicals that melt when heated. This article describes the evaluation of the Hazen color using a spectrophotometer compliant with these specifications.
Experimental
How to determine Hazen color
The [Color Evaluation (Hazen Color)] program calculates tristimulus values (X, Y, Z) from the absorption spectra for standard samples, calculates the yellowness index (YI) based on X, Y, Z, and then creates a calibration curve of YI against the Hazen color of the standard solutions. Finally, the sample color in Hazen units is determined from the calibration curve.
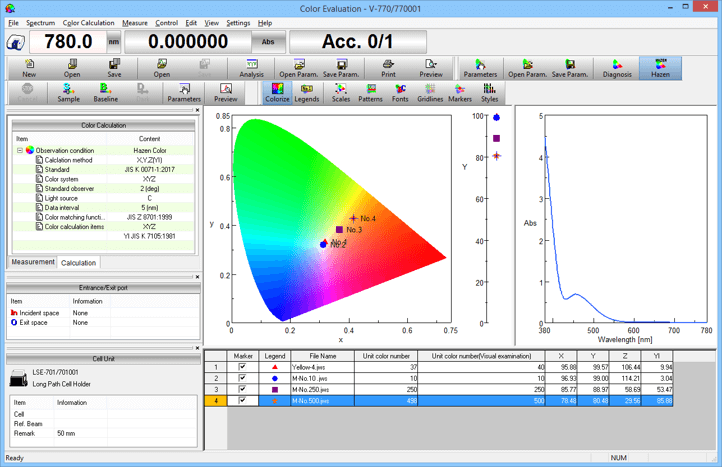
Figure 1. [Color Evaluation (Hazen Color)] program window
Furthermore, the Hazen color that minimizes the color difference ∆E*ab between the standard solution and the sample can be obtained. A calibration curve of the Hazen color against the chromaticity coordinate b* for standard solutions, or against the absorbance at a specific wavelength, can also be created, and the Hazen color for the sample can be determined from the calibration curve. In this experiment, the Hazen color for the sample was determined using the calibration curve for the Hazen color against the YI for standard solutions.
Sample
Standard stock solution (Hazen units 500): a solution in which 100 mL of hydrochloric acid (35-37%) was added to 1.245 g of potassium hexachloroplatinate (IV) and 1.000 g of cobalt (II) chloride hexahydrate, with the total volume adjusted to 1000 mL with water.
Standard solutions: a solution prepared by diluting a standard stock solution with water to produce Hazen colors of 0, 5, 10, 15, 20, 25, 30, 35, 40, 50, 60, 70, 80, 90, 100, 125, 150, 200, 250, 300, 350, 400, 450 and 500.
Samples: standard solutions prepared separately with Hazen colors of 10, 250 and 500. Also, 240 mg/L of food yellow No. 4 (tartrazine) aqueous solution.
Measurement parameters
Bandwidth: 1 nm
Response: 0.96 sec.
Scan speed: 400 nm/min.
Data interval: 1 nm
Color calculation parameters
Light source: C
Color matching function: JIS Z 8701:1999
Observation angle: 2 degrees
Data interval: 5 nm
Keywords
Ultraviolet-visible spectrophotometer, Hazen color, APHA (American public health association), JIS K 0071-1: 2017, ISO 6271: 2015, ASTM D 1209: 2005, tristimulus values (X, Y, Z), yellowness index (YI)
Results
Measurement results
Figure 2 shows spectra for standard solutions and samples.
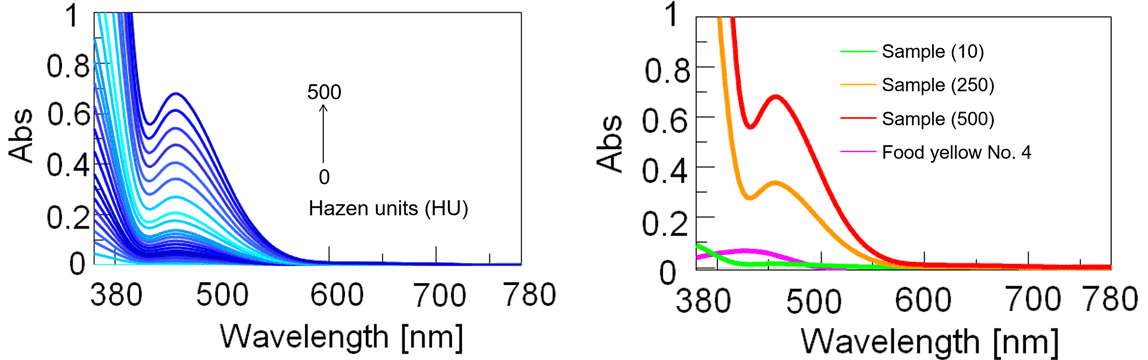
Figure 2. Spectra for standard solutions (left) and samples (right)
Analysis results
Figure 3 shows the calibration curve for the yellowness index (YI) calculated based on the Hazen color and tristimulus values (X, Y, Z) for standard solutions. A high correlation coefficient of 1.0000 was found between the Hazen color and YI using a cubic formula.
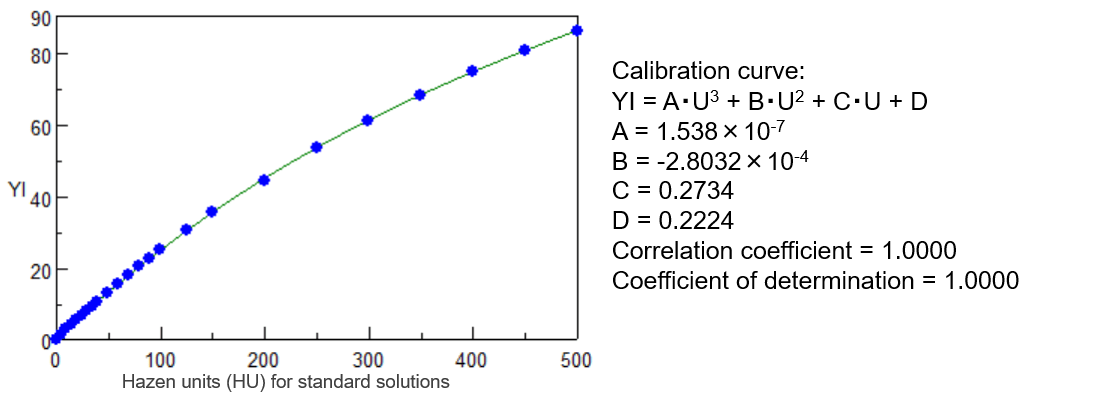
Figure 3. Calibration curve for yellowness against Hazen color
Figure 4 shows a plot of the color coordinates for the standard solutions and the samples on an xy-chromaticity diagram, and Table 1 shows the Hazen color obtained from the calibration curve and the Hazen color estimated visually.
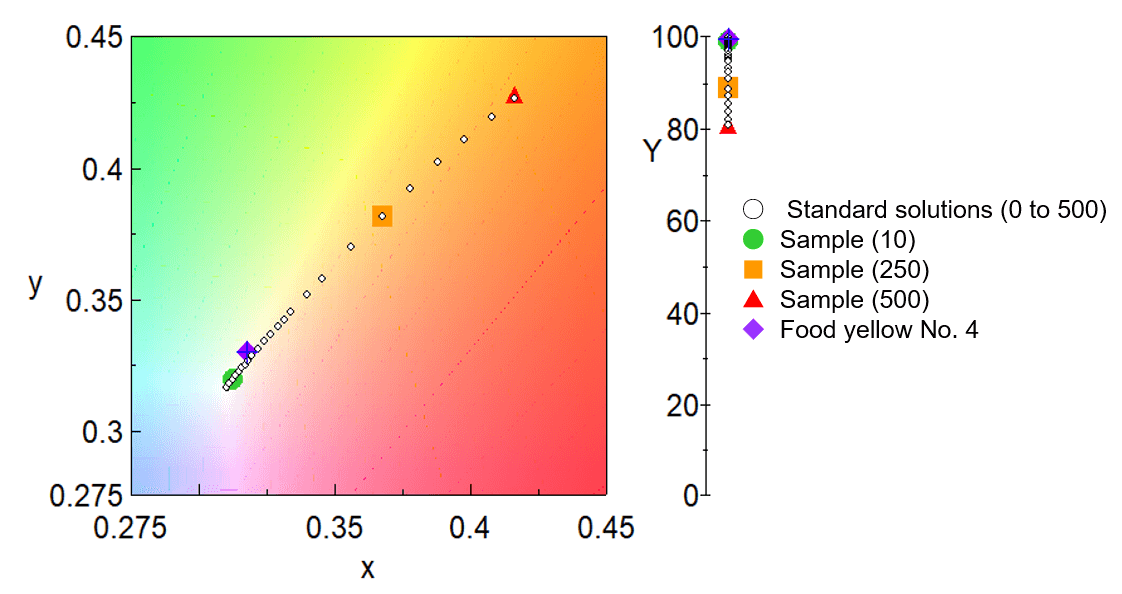
Figure 4. xy Chromaticity diagram showing color coordinates for standard solutions and samples
Table 1. Analysis results for Hazen color
| Sample name | Hazen color (spectrophotometer) | Hazen color (visual method) | X | Y | Z | YI |
|---|---|---|---|---|---|---|
| Sample (10) | 10 | 10 | 97.18 | 99.25 | 114.63 | 2.91 |
| Sample (250) | 250 | 250 | 85.77 | 88.97 | 58.69 | 53.47 |
| Sample (500) | 498 | 500 | 78.48 | 80.48 | 29.56 | 85.88 |
| Food yellow No. 4 | 37 | 35 | 95.88 | 99.57 | 106.44 | 9.94 |
Using the calibration curve, the Hazen colors of samples with nominal values of 10, 250, and 500 were found to be 10, 250 and 498, respectively. The Hazen color for yellow No. 4, which had a different absorption spectrum shape, was 37.
The specifications of the V-700 series ultra-violet visible spectrophotometer and the [Color Evaluation (Hazen Color)] program enable evaluation of the Hazen color in a manner compliant with JIS K 0071-1:2017, ISO 6271: 2015 and ASTM D 1209: 2005.


