Introduction
Fluorescent and phosphorescent substances are widely used in fields such as fluorescent whitening agents and inks, light sources for displays and lighting, and fluorescent probes in biotechnology. For substances that emit visible luminescence, their luminescence color is sometimes evaluated in addition to their emission spectrum.1)-5)
In this report, we focus on a phenomenon called solvatochromism and present a case study in which we measured the fluorescence spectra of samples emitting luminescence with various colors and evaluated their luminescence color. Solvatochromism can be defined as a phenomenon in which a dye or fluorescent substance changes color due to a change in its absorption or emission spectrum when dissolved in different solvents. Fluorescent dyes that exhibit solvatochromism are attracting attention because they can be used as probes for polarity changes around molecules. In such research fields, luminous color is an important property.6-11)
Experimental
Fluorescence spectra calibrated using the instrument function for the spectrofluorometer were measured and the luminous color was calculated
<Sample>
A solution of 4-(N,N-dimethylamino)-4’-nitrosilbene (DNS, DANS) dissolved in n-hexane (Hex), cyclohexane (c-Hex), toluene (Tol), diethylether (Et2O), ethyl acetate (AcOEt), dichloromethane (DCM), and their mixture.
<System>
Instrument: FP-8350 Spectrofluorometer
Accessory: ESC-142 Calibrated WI light source
Software: FWLU-179 Luminous color measurement program
<Parameters>
Ex bandwidth: 5 nm
Em bandwidth: 5 nm
Ex wavelength: 320 nm
Measurement range: 380 nm-780 nm
Response: 0.2 sec
Scanning speed: 500 nm/min
Keywords
Fluorescence, luminous color, functional fluorescent dye, solvatochromism, DNS, DANS, stilbene
Results
Fluorescence spectra
The fluorescence spectra and luminous color analysis results for each sample are shown below.
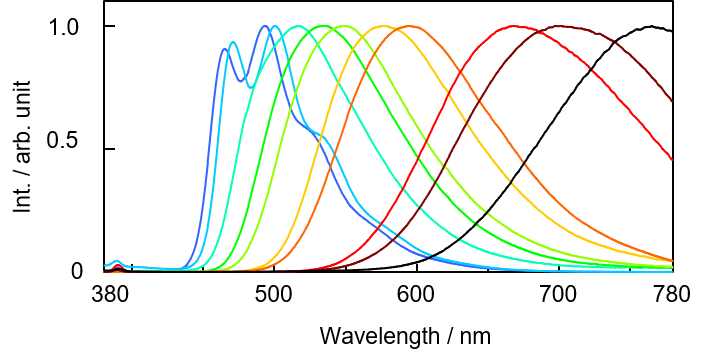
Fig. 1 DNS fluorescence spectrum for each solvent
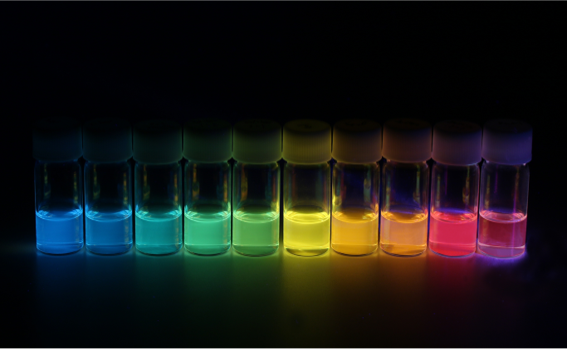
Fig. 2 Fluorescence emission for each sample
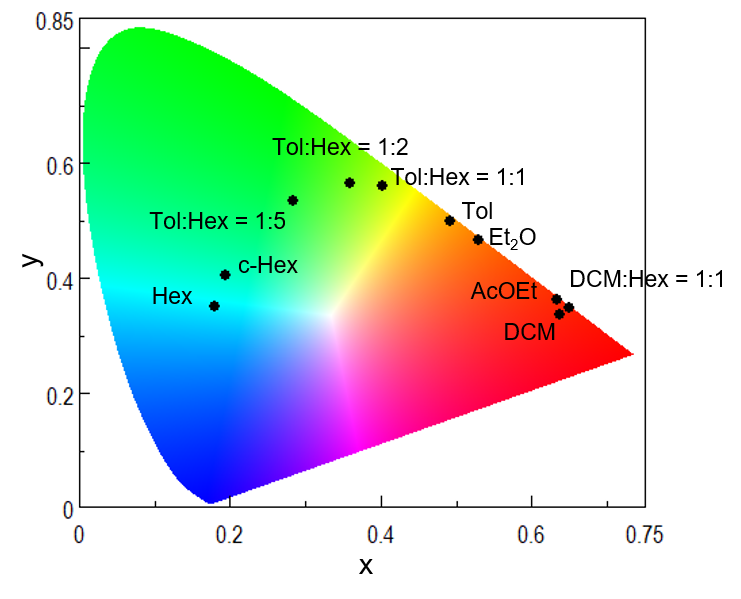
Fig. 3. CIE chromaticity diagram for luminous color analysis results
Table 1. Peak position and chromaticity coordinates in each solvent
| Solvent | Polarity index | Peak / nm | x | y |
| Hex | 0.1 | 493 | 0.179 | 0.349 |
| c-Hex | 0.2 | 501 | 0.195 | 0.402 |
| Tol:Hex = 1:5 | 0.3* | 517 | 0.283 | 0.532 |
| Tol:Hex = 1:2 | 0.9* | 537 | 0.358 | 0.564 |
| Tol:Hex = 1:1 | 1.3* | 549 | 0.402 | 0.557 |
| Tol | 2.4 | 576 | 0.492 | 0.498 |
| Et2O | 2.8 | 595 | 0.530 | 0.464 |
| AcOEt | 4.4 | 668 | 0.634 | 0.360 |
| DCM:Hex = 1:1 | 1.6* | 698 | 0.650 | 0.346 |
| DCM | 3.1 | 765 | 0.638 | 0.334 |
※Calculated from polarity index and volume ratio of solvent used for mixing
For solvents other than DCM and DCM:Hex = 1:1, the peak of the fluorescence spectrum shifted to longer wavelength with increasing polarity index. Solvents with different polarities have different ground and excited states for which the sample is stabilized, resulting in a change in the energy gap, which in turn changes the fluorescence wavelength. However, the direction in which the fluorescence wavelength shifts depends on the solute compound. DNS was found to exhibit positive solvatochromism because the emission peak shifted to longer wavelength as the polarity increased.
Although AcOEt, DCM:Hex = 1.1 and DCM caused a change in spectral shape and fluorescence peak position, as shown in Fig. 1, the chromaticity coordinates for the sample solution were similar. This is because for these solvents, the sample emits fluorescence at a wavelength of 700 nm or longer, where the luminosity is low, and fluorescence in this region makes only a small contribution to the chromaticity coordinates.
Conclusion
In this report, we described the measurement and color evaluation of samples emitting different luminous colors based on the solvatochromism effect. The [Luminous Color Measurement] program is an effective tool for the evaluation of luminescence in the visible wavelength region because, in addition to fluorescence measurements, it can also perform spectral measurements and color evaluation of light sources themselves and samples that emit fluorescence without the need for excitation light, such as in the case of chemiluminescence.
References
1.G. Naren, C.-W. Hsu, S. Li, M. Morimoto, S. Tang, J. Hernando, G. Guirado, M. Irie, F. M. Raymo, H. Sundén, J. Andréasson: Nat. Commun. 10, 3996 (2019). DOI: 10.1038/s41467-019-11885-4.
2.A. Goel, V. Kumar, S. P. Singh, A. Sharma, S. Prakash, C. Singh, R. S. Anand: J. Mater. Chem. 22, 14880 (2012). DOI: 10.1039/c2jm31052j.
3.C.-Y. Sun, X.-L. Wang, X. Zhang, C. Qin, P. Li, Z.-M. Su, D.-X. Zhu, G.-G. Shan, K.-Z. Shao, H. Wu, J. Li: Nat. Commun. 4, 2717 (2013). DOI: 10.1038/ncomms3717.
4.M. H. Lee, J. S. Kim, J. L. Sessler: Chem. Soc. Rev. 44, 4185 (2015). DOI: 10.1039/c4cs00280f.
5.L. Wang, W. Li, L. Yin, Y. Liu, H. Guo, J. Lai, Y. Han, G. Li, M. Li, J. Zhang, R. Vajtai, P. M. Ajayan, M. Wu: Sci. Adv. 6, eabb6772 (2020). DOI: 10.1126/sciadv.abb6772.
6.N. Pandey, N. Tewari, S. Pant, M. S. Mehata: Spectrochim. Acta A Mol. Biomol. Spectrosc. 267, 120498 (2022). DOI: 10.1016/j.saa.2021.120498.
7.A. Gonciarz, M. Żuber, J Zwoździak: ChemistryOpen, 7, 677 (2018). DOI: 10.1002/open.201800100.
8.A. Belyaev, S. O. Slavova, I. V. Solovyev, V. V. Sizov, J. Jänis, E. V. Grachova, I. O. Koshevoy: Inorg. Chem. Front. 7, 140 (2020). DOI: 10.1039/c9qi01015g.
9.V. Ferraro, M. Girotto, M. Bortoluzzi: Chem. Proc. 8, 87 (2022). DOI: 10.3390/ecsoc-25-11658.
10.A. Tabuchi, T. Hayakawa, S. Kuwata, R. Ishige, S. Ando: Mater. Adv. 2, 5629 (2021). DOI:10.1039/d1ma00308a
11.J. Wang, N. Wang, G. Wu, S. Wang, X. Li: Angew. Chem. Int. Ed. 58, 3082 (2019). DOI: 10.1002/anie.201812210.


 properties of platinum complexes using a CPL measurement system and a spectrofluorometer")

