Introduction
Recently, excitation-emission matrix (EEM) measurements and parallel factor (PARAFAC) analyses have been widely used for evaluating the quality of environmental water, such as in rivers and lakes.
Such water often contains compounds such as humic acid, tryptophan, and artificial chemicals. Therefore, multiple overlapping peaks appear in the EEM. PARAFAC is a very powerful analysis method in such situations and can separate the principal components of EEM. It can be used to predict the compounds present by comparing with published EEM. It can also be used for quantitative analysis.
In this article, a PARAFAC analysis of EEM for river water is described.
FP-8350 spectrofluorometer
Experimental
Measurement conditions
Excitation range: 250–450 nm
Emission range: 260–700 nm
Bandwidth (excitation): 5 nm
Bandwidth (emission): 5 nm
Excitation step: 5 nm
Scanning speed: 1000 nm/min.
Response: 50 msec.
Sensitivity: Medium
Samples
30 water samples (3 samples each at 10 locations shown in figure)
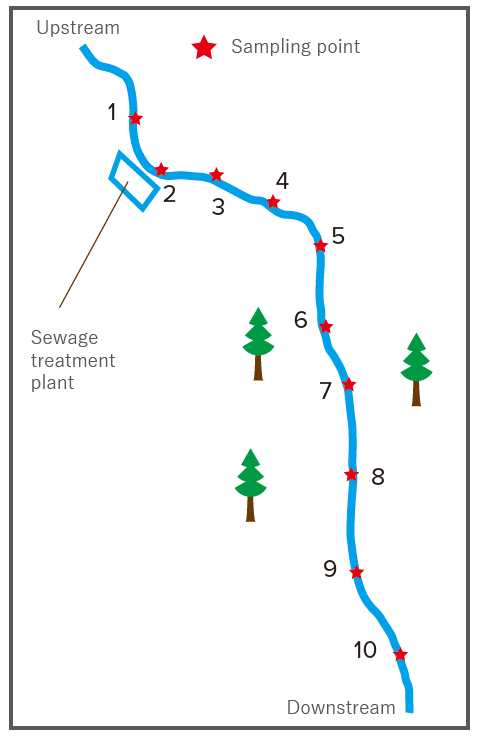
Figure 1. Schematic diagram of sampling points
Results
Representative EEM for each sampling point are shown in figure 2.
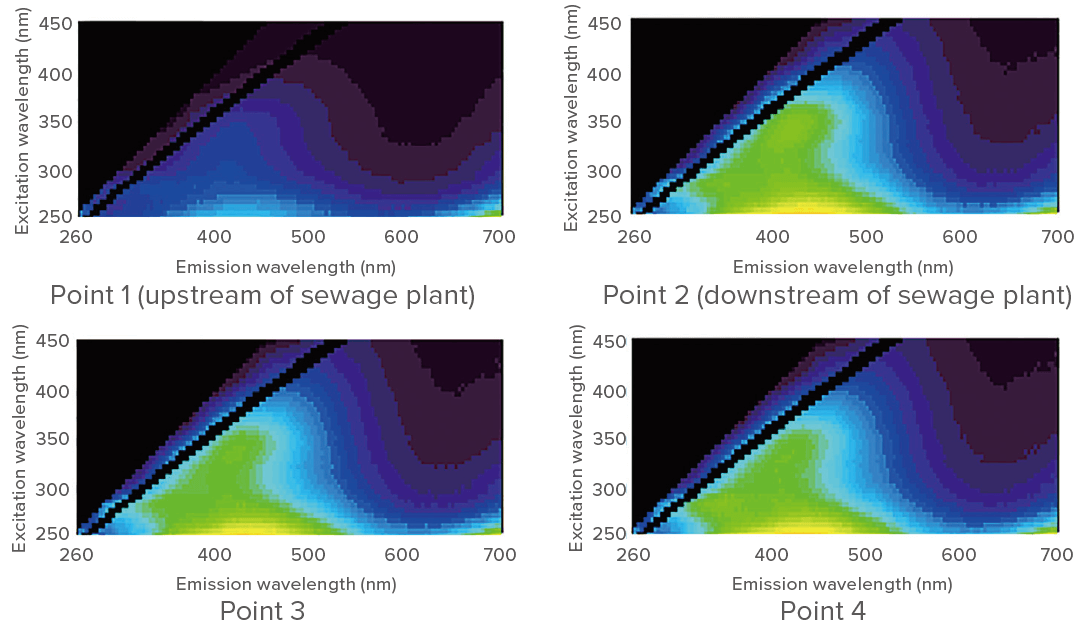
Figure 2. EEM for each sampling point (examples)
A PARAFAC analysis was applied to 30 sets of EEM. When the number of components was set to 4, the results of PARAFAC analysis were as shown
in figure 3.
Based on the literature[1], components 1 and 3 appear to be humic acid-like compounds and component 2 appears to be tryptophan. Component 4 is a residual error. Score plots for the different components are shown below.
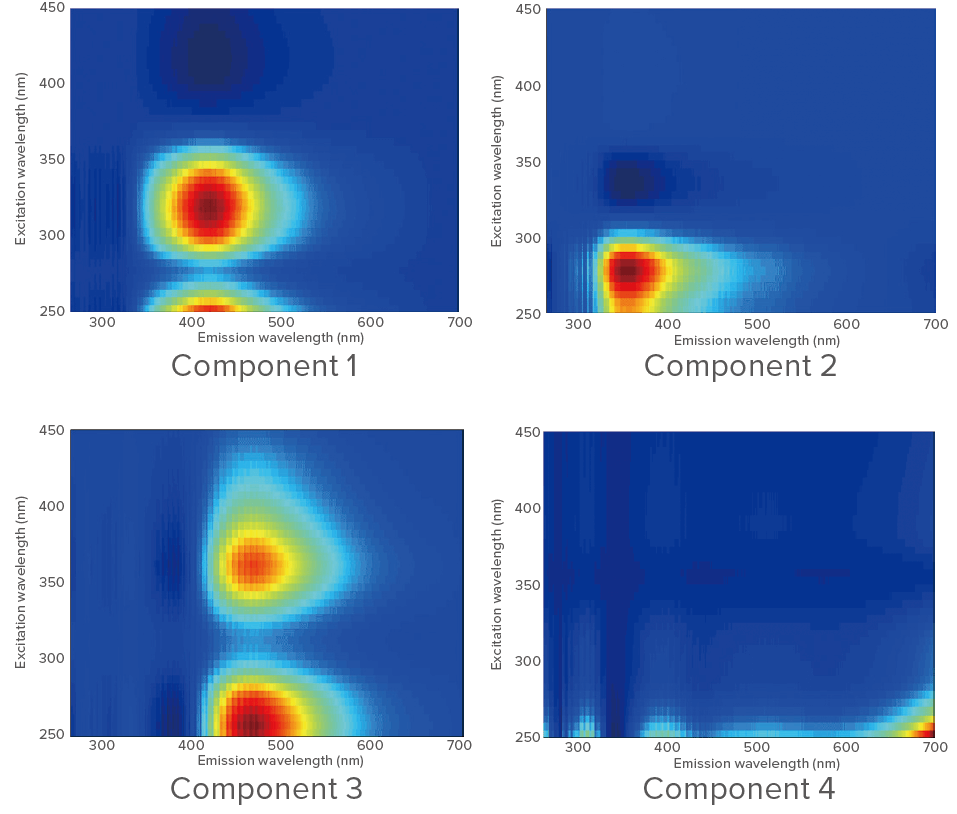
Figure 3. Components determined by PARAFAC (assuming 4 components)
Clustering based on the sampling points can be seen. The results indicate a sudden increase (about 2.5 to 3 times) in the concentration of humic acid-like compounds and tryptophan downstream of the sewage treatment plant, but then no rapid increase between points 2 and 5.
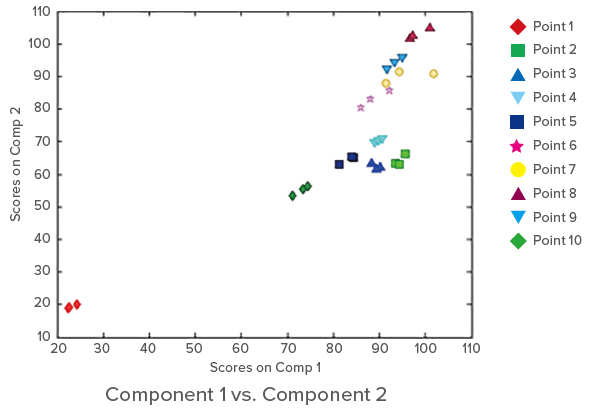
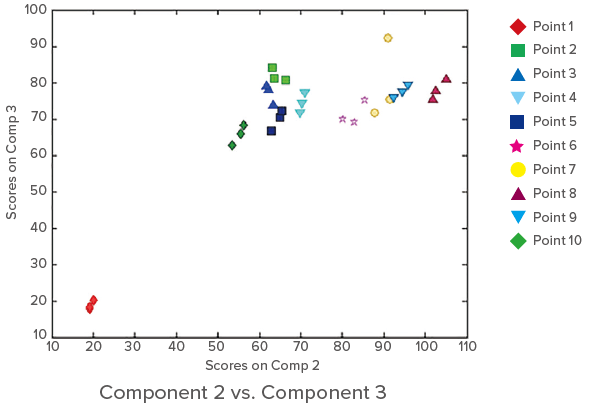
Figure 4. Score plots
References
[1] Chen. W. et.al. Environ. Sci. Tech. 2003, 37, 5701-5710.
Acknowledgment
Special thanks to Prof. K. Sankoda (Saitama University) who provided the sample.


