Introduction
Enzyme activity is frequently investigated in the medicinal, biochemistry, and food science research fields to elucidate reaction rates and the affinity of enzyme-substrate interactions. There are some ways to monitor the process of enzyme-substrate interactions, and spectrofluorometer is one of their effective tools.
JASCO offers the hardware/software for enzyme kinetics, which provides the reliable data. This section introduces how to obtain enzyme kinetic data.
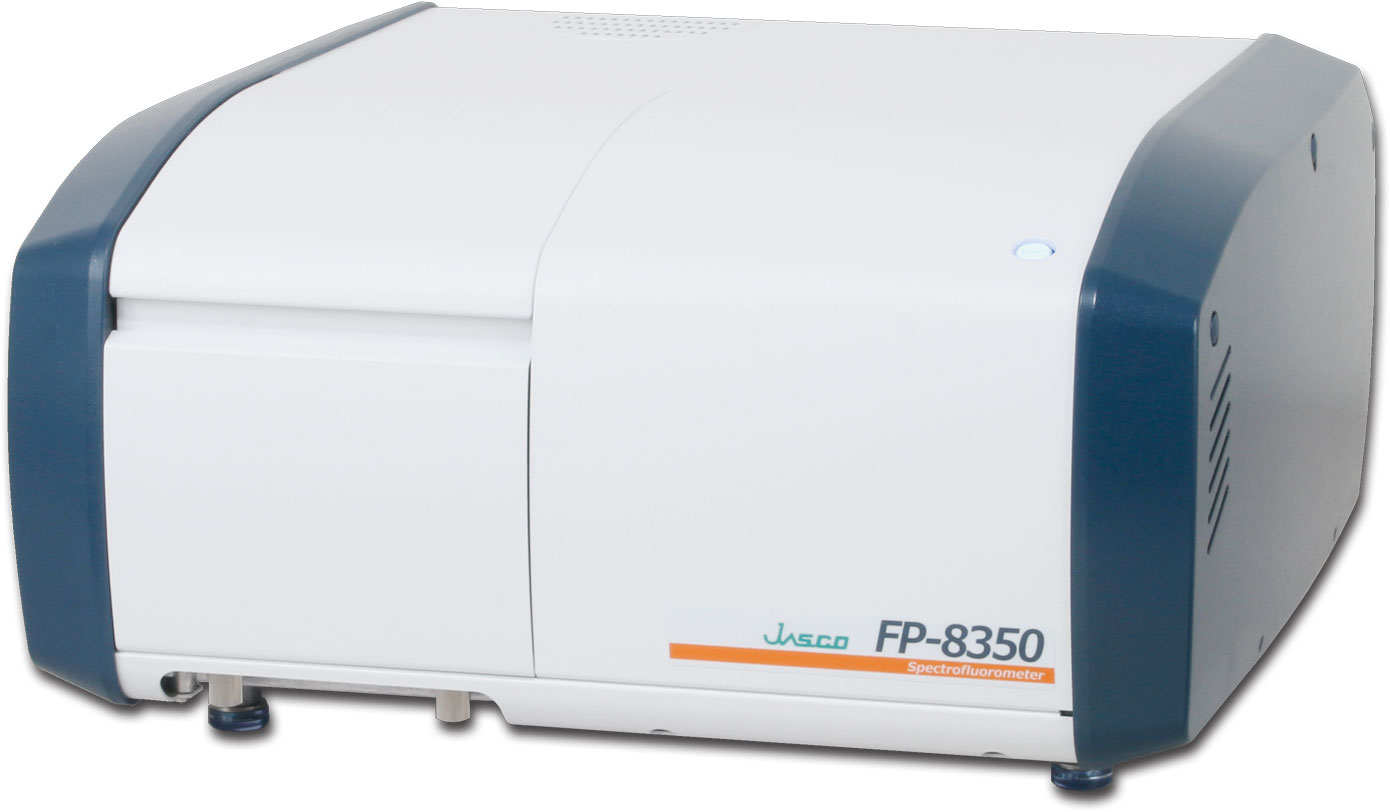
FP-8350 Spectrofluorometer
Overview
One of the best-known models of enzyme kinetics is Michaelis-Menten kinetics. It is the reaction model that an enzyme (E) binds to a substrate (S) to form a complex (ES), which in turn releases a product (P) regenerating the original enzyme.

The initial velocity (v) of formation of P is represented as the following formula.
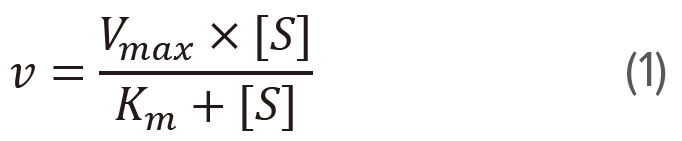
This equation is called the Michaelis-Menten equation. Here, [S] is the substrate concentration. Vmax represents the maximum reaction velocity at saturating substrate concentration, and Km , which is called the Michaelis constant, is equal to the substrate concentration at which the reaction velocity is half of Vmax. Plot v versus [S] based on the equation (1) is called Michaelis-Menten plot (figure 1), which enables to calculate the Vmax and Km.

Figure 1. Michaelis-Menten plot
The high Vmax means that the maximum activity of target enzyme is high. In addition, Km indicates the affinity between enzyme and substrate. Low Km means that the affinity between enzyme and substrate is high, and enzyme-substrate complex is formed quickly. On the other hand, high Km means that the affinity between enzyme and substrate is low, and enzyme-substrate complex is formed slowly. Vmax and Km, can be calculated by the following procedure, which requires the analytical instrument such as the spectrofluorometer.
(1) Adds the substrate into enzyme solution, and perform time-course measurement, which monitors the fluorescence intensity of product or substrate.
(2) Obtains the initial velocity (v) by the slope at the start of reaction.
(3) Changes the substrate concentration, and obtains the initial velocity (v) through (1) and (2). And then, create [S] versus v plot.
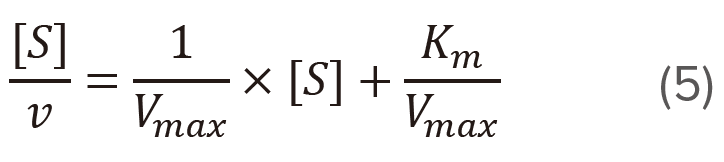
Since obtaining Vmax and Km from Michaelis-Menten plot by eye makes the error easily, the modification of equation (1) is performed. The following methods are well-known as the modification method of Michaelis-Menten equation, and Vmax and Km can be obtained from slope and intercept of these plot.
Lineweaver-Burk plot: 1/[S] vs 1/v
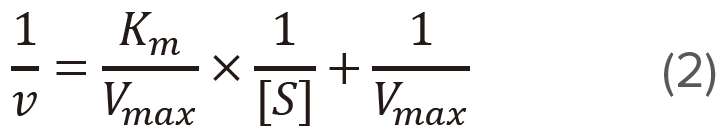
Plot 1/v versus 1/[S] (Figure 2) based on the modified version of the Michaelis-Menten equation given above.
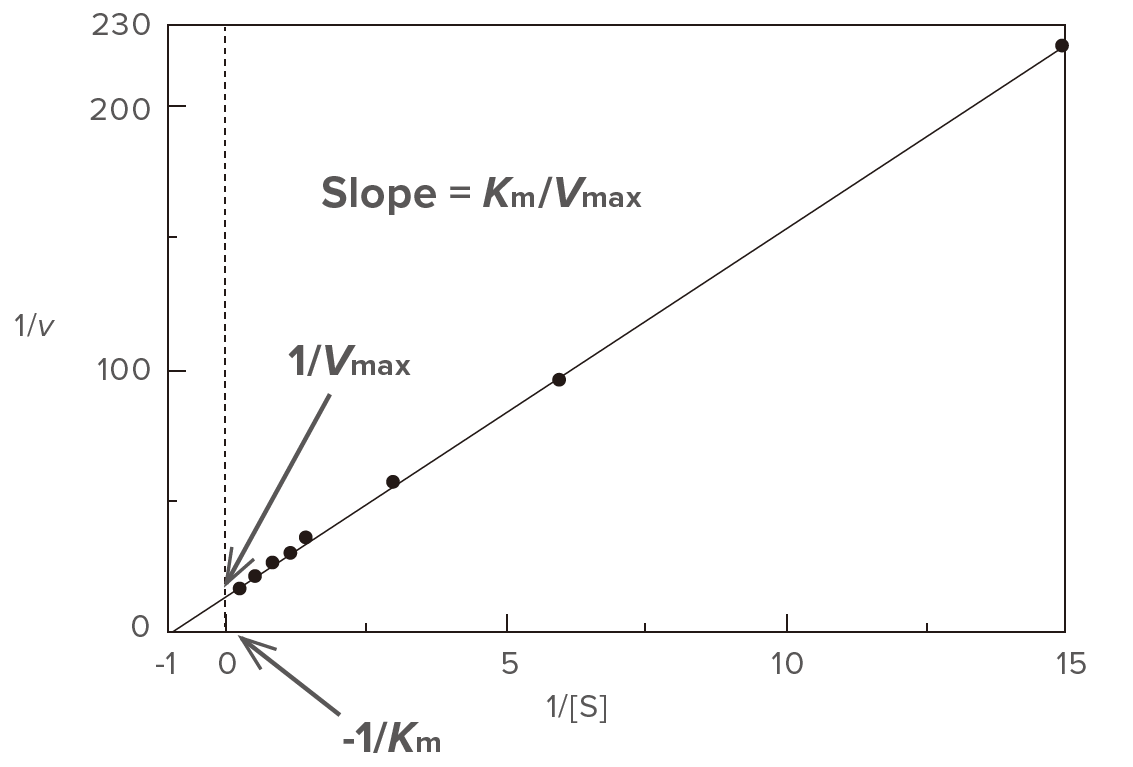
Figure 2. Lineweaver-Burk plot
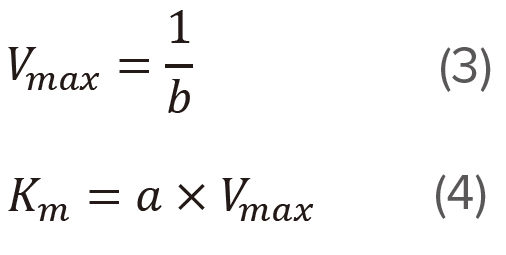
Determine the slope (a) and the intercept (b) of the straight line using the least squares method and then calculate Vmax and Km using equations (3) and (4), respectively. This plot is often used for calculating Vmax and Km, and is effective at low substrate concentration range.
Hofstee plot: [S] vs [S]/v
Plot [S]/v versus [S] (Figure 3) based on the modified version of the Michaelis-Menten equation given above.
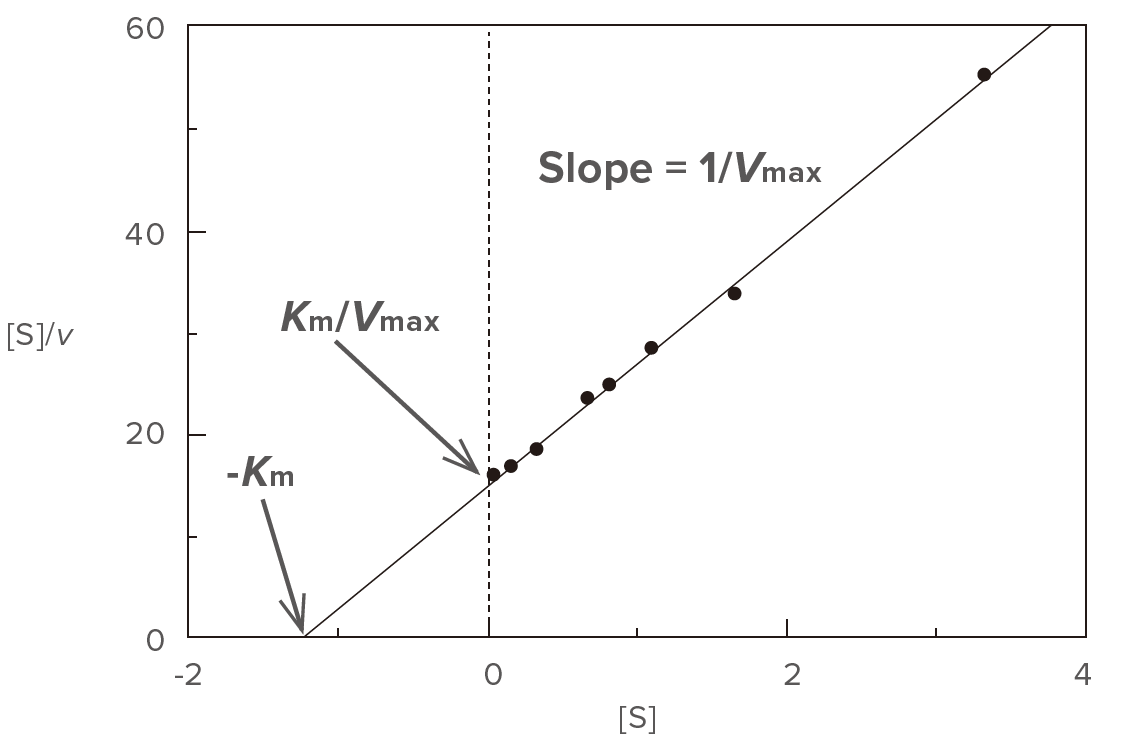
Figure 3. Hofstee plot
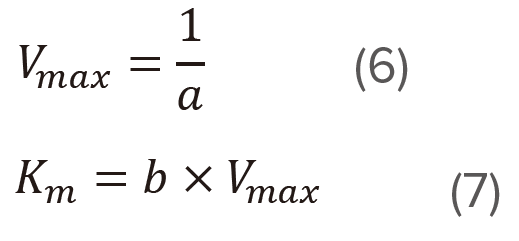
Determine the slope (a) and the intercept (b) of the straight line using the least squares method and then calculate Vmax and Km using equations (6) and (7), respectively. This plot is effective at high substrate concentration range.
Eadie plot: v/[S] vs v
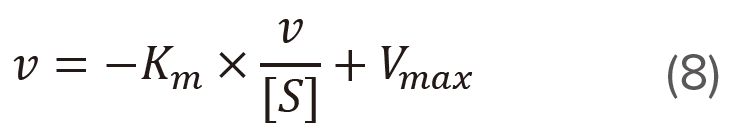
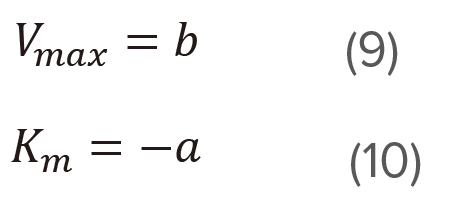
Plot v versus v/[S] (Figure 4) based on the modified version of the Michaelis-Menten equation shown above.
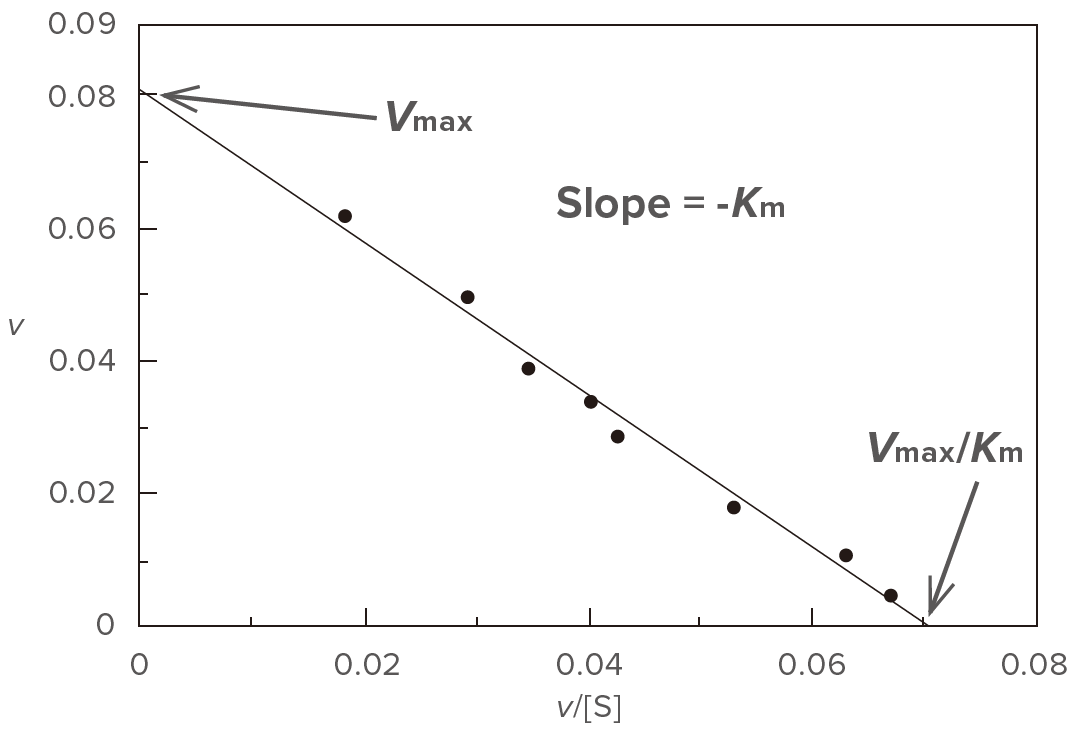
Figure 4. Eadie plot
Determine the slope (a) and the intercept (b) of the straight line using the least squares method and then calculate Vmax and Km using equations (9) and (10), respectively. This plot is effective at wide range of substrate concentration.