Introduction
Refractive Index detector (RI detector) is widely used in HPLC analysis such as GPC measurement because of its versatility. RI detector detects the difference of refraction index of solvents, so the baseline was influenced by the room temperature change. To remove this influence of the room temperature, JASCO has developed the RI detector with high-accurate temperature control function.
In this article, the evaluation about effectivity of temperature control function were implemented with using water as mobile phase. One is comparison of time in baseline stability after starting the cell temperature control. The other is comparison of measurement result of sugar alcohol.
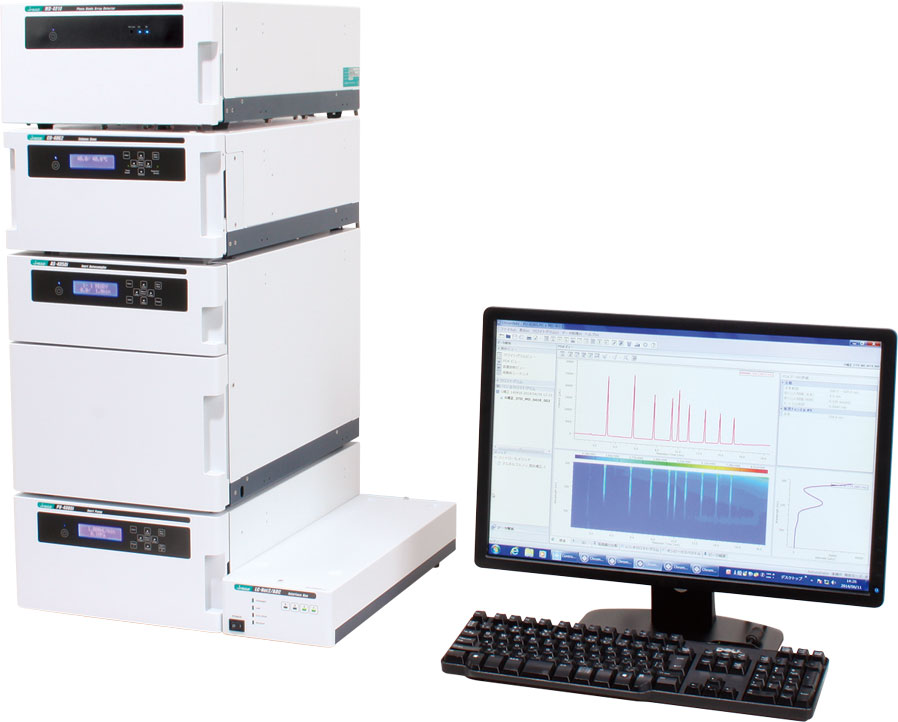
LC-4000 HPLC system
Keywords
HPLC, Baseline, Refractive Index detector
Results
Baseline stability by temperature control function
Figure 1 shows the baseline with using new model RI detector (with temperature control function) and old model one. As shown in the figure, new model RI detector provides stability in 60 min after starting cell temperature control. Old model RI detector provides stability in 160 min. The drift (approximately 0.3 µRIU/h) in 60 min is equivalent to the drift of baseline of polystyrene standard (0.05%(w/v)), which is shown in figure 2.
*Some organic solvent make drift worse with cell temperature control.
<Experimental Condition>
Eluent : Water
Flow rate: 1.0 mL/min
Cell temp.: 40 ºC
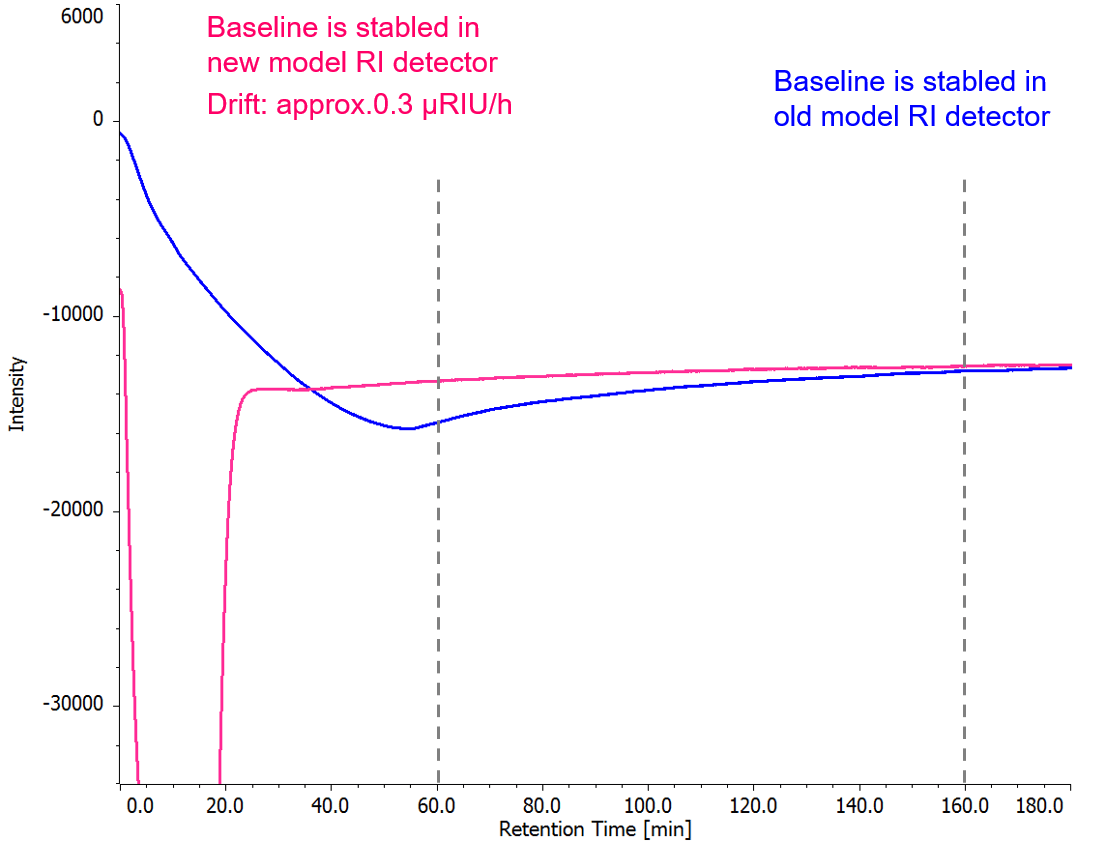
Figure 1. Baseline (Red: new model, Blue: old model)
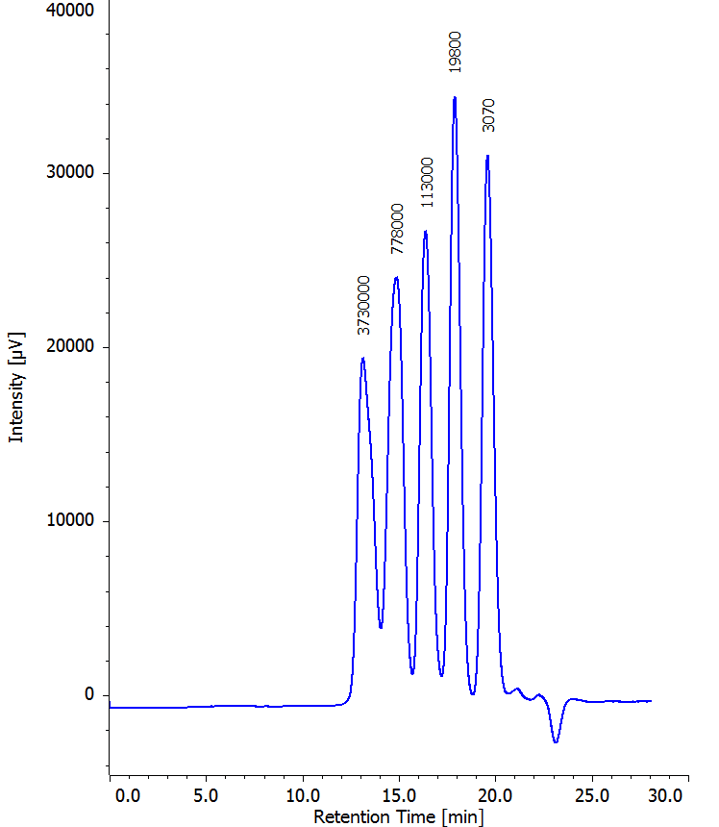
Figure 2. Analysis of polystyrene 0.05%(w/v) (drift: approx.0.3 μRIU/h)
Measurement of sugar alcohol
The baseline noise of detectors affects to measurement sensitivity too. Under same system condition with new model RI detector and old model one, the comparison of noise and sensitivity (SN ratio) are measured and confirmed.
Figure 3 and 4 shows the measurement result of sugar alcohol with using new model RI detector and old model one. Table 1 shows the SN ratio of each peak.
<Experimental Condition>
Column: Inertsil Amide (4.6 mmI.D. x 250 mmL, 5 µm)
Eluent : Water/Acetonitrile (30/70)
Flow rate: 1.0 mL/min
Column temp.: 30 ºC
Injection volume: 20 µL
Standard Sample: Suger alchols mixture (5 mg/mL each)
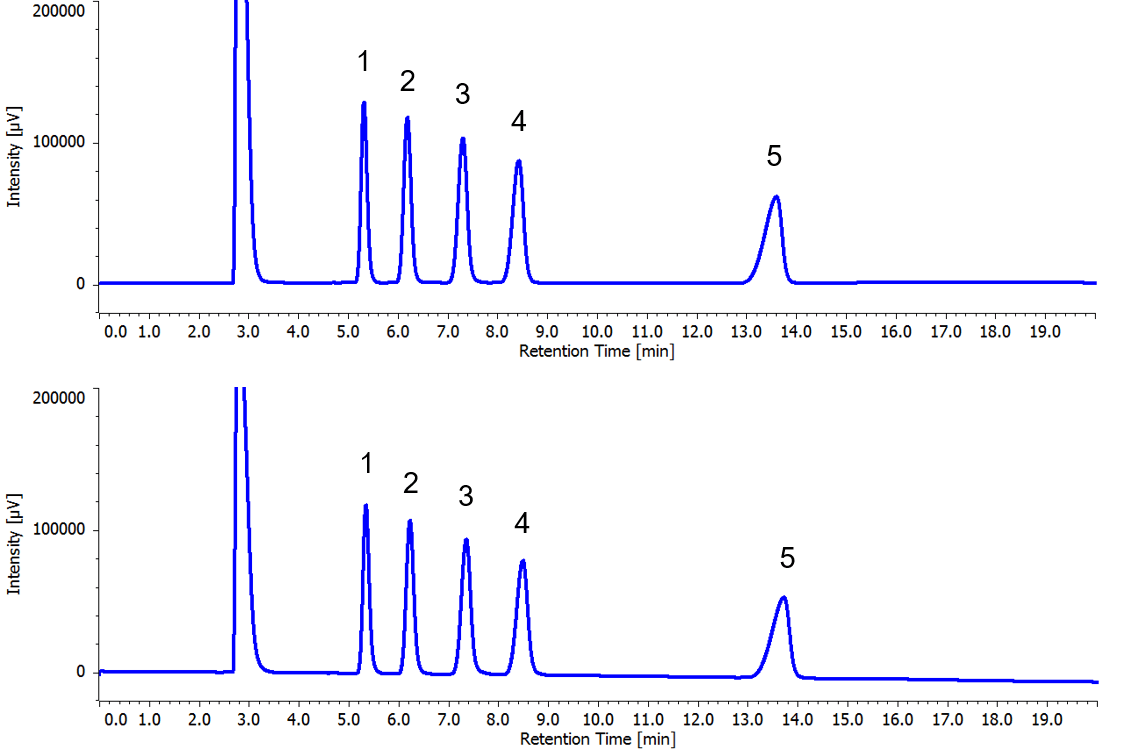
Figure 3. Result of sugar alcohol measurement (Top: new model RI detector, Bottom: old model RI detector, 1. Glycerine, 2. Erythritol, 3. Xylitol, 4. Solbitol, 5. Inositol)
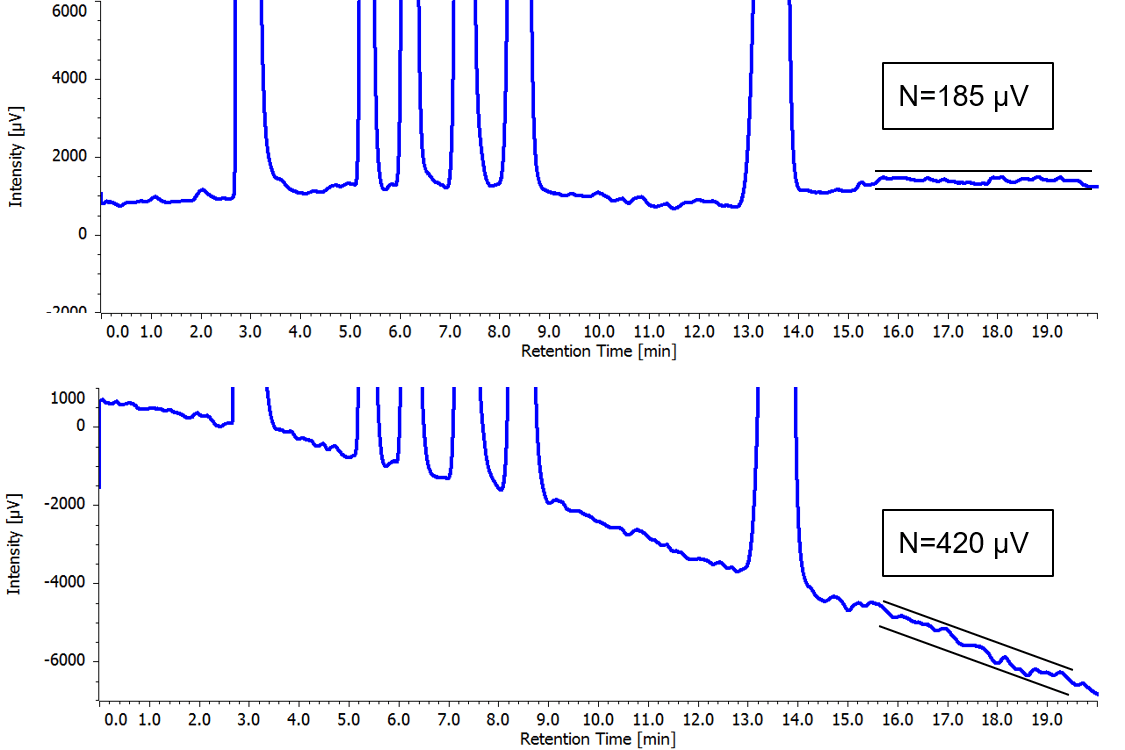
Figure 4. Zoom view of sugar alcohol measurement baseline (Top: new model RI detector, Bottom: old model RI detector)
Table 1. Calculation result of SN ratio of each peak
| Glycerine | Erythritol | Xylitol | Solbitol | Inositol | |
| New model RI detector | 689.1 | 628.6 | 550.8 | 469.8 | 329.7 |
| Old model RI detector | 282.0 | 256.3 | 225.6 | 190.9 | 135.6 |
In figure 3, the baseline looks stabled. But in figure 4, new model RI detector provides twice lower noise level than old model one and the baseline is also stabled in new model one.
As shown in the table 1, new model RI detector can provides the twice higher SN ratio than old model one.


