Introduction
This application note compares the accuracy of thermal melting measurements of a DNA sample using the temperature sensor inside a cell compared to the block sensor using the the V-730 with PAC-743 . The 8-position micro cell sensors as a temperature monitor (Figure 1), the horizontal axis of the temperature course data can be plotted with actual temperatures obtained by the sensor. This increases the temperature accuracy of small volume sample measurements as 10 µL with the 1 mm 8-position micro cell.
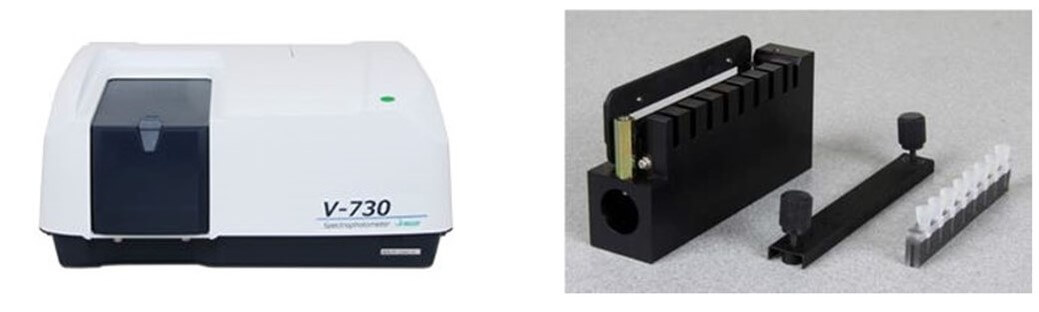
V-730 UV-Visible Spectrometer (left) and PAC-743 Peltier 8-position cell changer (right)
For thermal melting studies, a temperature sensor can be inserted into a sample cell and the actual temperature of the samples plotted in order to increase the accuracy of the temperature readings for the melting experiment. This measurement technique is easily applied to 10 mm rectangular cells with larger sample volumes. However, for samples with small sample volumes (< 100 µL) a temperature sensor probe blocks the instrument’s optical path. It is then difficult to obtain both absorbance and temperature measurements of a sample simultaneously. By using one of the cells to monitor the sample temperature without obtaining absorbance measurements at that position, the melting temperature of the sample solution can be accurately recorded.
Additionally, when performing a melting measurement on samples available in extremely small amounts, volatilization of the sample can occur at high temperatures, frequently complicating the analysis process. Placing a silicon cap on the cell can prevent sample volatilization.
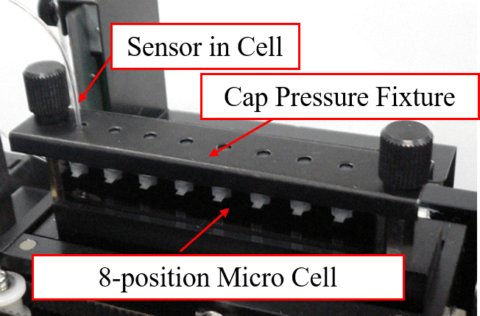
Fig.1 The 8-position micro cell sensors as a temperature monitor
Experimental
A 200 µg/mL solution of poly (dA-dT)-Poly (dA-dT) was made in KH2PO4-NaOH buffer at pH 7. Samples were measured in cells 1-7 while cell 8 was used only to monitor the sample temperature.
Measurement Conditions
Wavelength: 260 nm
Response: Fast
Ramp Rate: 2°C/min
Start Condition: ±0.10ºC for 3 seconds
Data Interval: 1ºC (20-50ºC), 0.1ºC (50-70ºC), 1ºC (70-100ºC)
Keywords
V-730, UV-Visible/NIR, Biochemistry, PAC-743 water-cooled Peltier cell changer, VWTP-780 Temperature Control Measurement Program, DNA Thermal Melting
Results
The melting curves from the results of sample measurements with all eight micro cells using the holder sensor are plotted as shown in Figure 2 (left). No volatilization of the samples was observed (Figure 2 (right)).
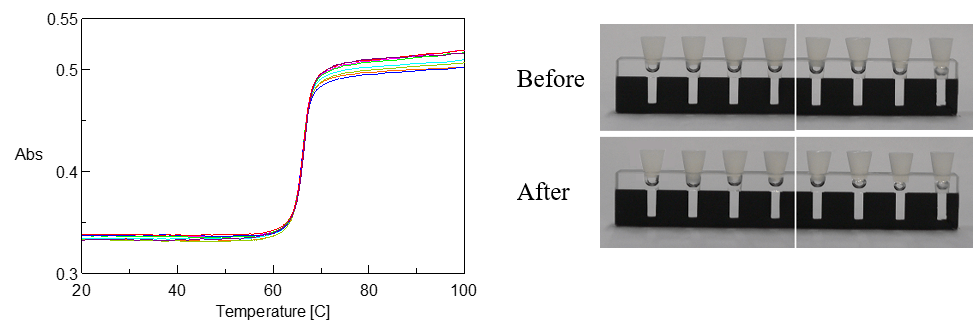
Figure 2. Thermal melt of poly (dA-dT)-Poly (dA-dT) using the PAC-743 holder sensor (left) and Change in the sample volume before and after thermal measurements (right)
In order to enhance the accuracy of the temperature, one of the eight cells (referred to as “cell 8”) was used exclusively to monitor the sample temperature. Figure 3 (left) shows a result of melting curves using the temperature readings from internal cell sensor. These temperature values were plotted in the horizontal axis in Figure 4 using data collected from internal cell sensor in cell 8. No evaporation was observed in this case (Figure 3 (right)).
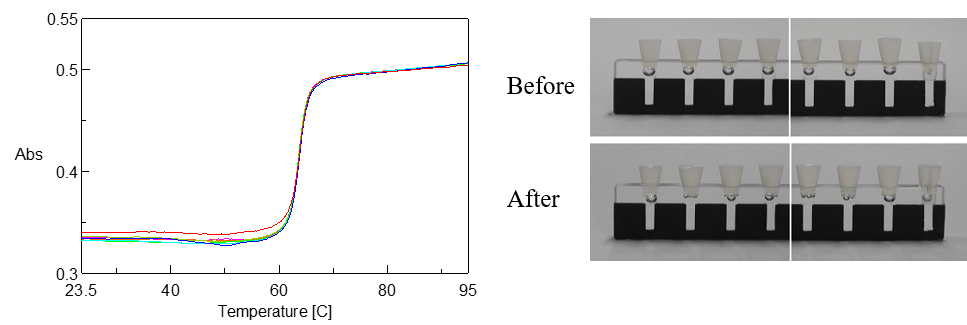
Figure 4. Thermal melt of poly (dA-dT)-Poly (dA-dT) using the internal cell sensor (left) Change in the sample volume before and after thermal measurements (right)
The results of the melting points, calculated from the melting curves data in Figure 2 and 3, are shown in Table 1. The results using the holder sensor are shown in Table 1 ranging melting temperature between 66.0ºC ~66.2ºC (average 66.1ºC) with standard deviation of 0.08ºC and coefficient of variance of 0.13%. On the other hand, the melting temperature results using the internal cell sensor range between 63.6ºC ~ 63.8ºC (average 63.7ºC) with standard deviation of 0.08ºC and coefficient of variance of 0.12%.
Table 1. Melting temperature (Holder sensor vs Internal cell sensor)
| Temperature °C | ||
| Hold Sensor | Internal Cell Sensor | |
| Cell 1 | 66.1 | 63.6 |
| Cell 2 | 66.0 | 63.6 |
| Cell 3 | 66.0 | 63.6 |
| Cell 4 | 66.1 | 63.6 |
| Cell 5 | 66.1 | 63.7 |
| Cell 6 | 66.0 | 63.7 |
| Cell 7 | 66.2 | 63.8 |
| Cell 8 | 66.2 | — |
| Average | 66.1 | 63.7 |
| Standard Deviation | 0.08 | 0.08 |
| C.V. | 0.13 | 0.12 |
Conclusion
The data show that the melting temperature using the holder sensor was approximately 3.5ºC higher than using the internal cell sensor, while both the standard deviation and coefficient of variance had no major differences in their result. These results indicate that the holder sensor can sufficiently measure a reproducible melting temperature for all sample cells. However, to obtain the absolute temperature value for sample melts, a cell temperature sensor is highly recommended.
 Analysis of CBN-Binding DNA Aptamer using CD Spectroscopy")


