Introduction
HPLC is a more effective method for quantitative estimation of trace amounts of compounds and for mixture separation/purification. HPLC is also used for analysis of medicinal products and in food science. In these fields, samples often have optical activity allowing analysis of enantiomeric excess and the separation/purification of the enantiomers.
JASCO has developed both dedicated CD detectors for HPLC as well as an HPLC flow cell for CD spectrometers. CD spectrometers provide high sensitivity, high resolution, and wide dynamic range, allowing high accuracy detection down to 200 nm.
In this article, the CD measurement of warfarin was carried out using CD spectrometer in a static mode as well as coupled to an HPLC system for on-line CD detection of the HPLC eluent.
J-1500 CD spectrometer
Experimental
In the CD spectral measurements, R-(+)-warfarin and S-(−)-warfarin are dissolved using a mixture of pH 2.0 aqueous phosphoric acid and acetonitrile, the mixture ratio is 1:1.
In the CD chromatographic measurement, racemic warfarin is dissolved using a similar mixture of pH 2.0 aqueous phosphoric acid and acetonitrile, the mixture ratio is 1:1.
Measurement parameters (CD spectrum measurement)
Wavelength range: 210 – 400 nm
Data interval: 0.1 nm
Response: 2 sec
Spectral bandwidth (SBW): 1 nm
Scan speed: 100 nm/min
Number of accumulations: 1
Optical pathlength: 1 mm
Concentration of sample: 200 µg/mL
Measurement parameters (CD chromatogram measurement)
Column: CHIRALCEL OD-RH column (4.6 mm I.D. x 150 mm L, 5 µm)
Wavelength range: 220 nm, 263 nm
Data interval: 1 sec
Response: 1 sec
Bandwidth: 1 nm
Optical pathlength: 10 mm
Concentration of sample: 200 µg/mL
Injection volume: 10 µL
Mobile phase: pH 2.0 aqueous phosphoric acid / acetonitrile (40/60)
Flow rate: 0.5 mL/min
Column temp.: room temperature
Keywords
Pharmaceutical, LCCD, Chiral analysis
Results
CD spectrum measurement
Figure 1 shows the CD and absorption spectrum of R-(+)-warfarin and S-(−)-warfarin. CD peaks are observed at 220, 263, 306 nm, which can be used as the detection wavelength for the CD chromatogram.
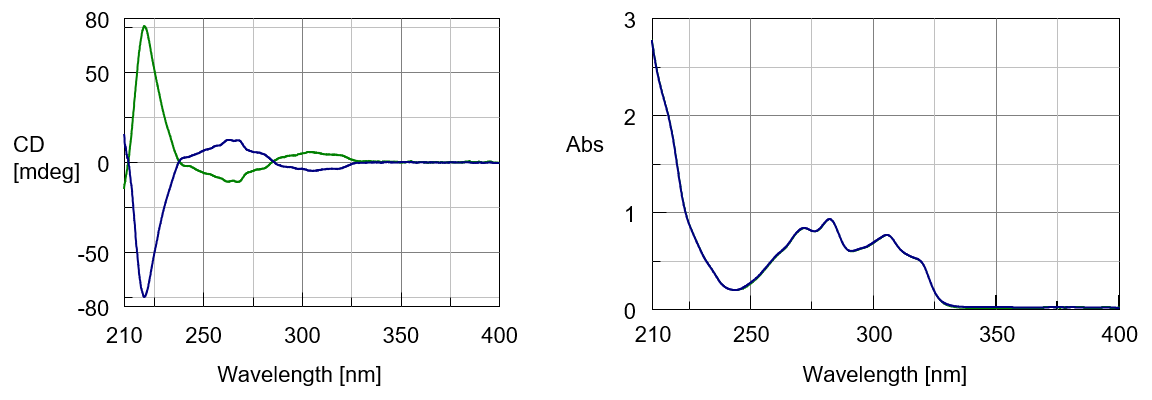
Figure 1. CD and absorption spectra of warfarin (Green: R-(+)-warfarin, Blue: S-(−)-warfarin)
CD chromatogram measurements
Figure 2 shows the CD and absorption chromatograms of R-(+)-warfarin and S-(−)-warfarin at 220 and 263 nm. The measurement was carried out using the Time Course Measurement mode. The measurement is initiated by the trigger signal of the manual or auto injector. The peak of R-(+)-warfarin is observed at 457 seconds and the peak of S-(−)-warfarin is observed at 587 seconds.
The CD and absorption signals at shorter wavelengths are generally greater providing higher sensitivity for measurement detection. As shown, the CD peak area detected at 220 nm is six times larger than the peak at 263 nm and the absorption peak area detected at 220 nm is twice as large than the absorption peak at 263 nm. The area ratio of R-(+)-warfarin and S-(−)-warfarin is 1:1.
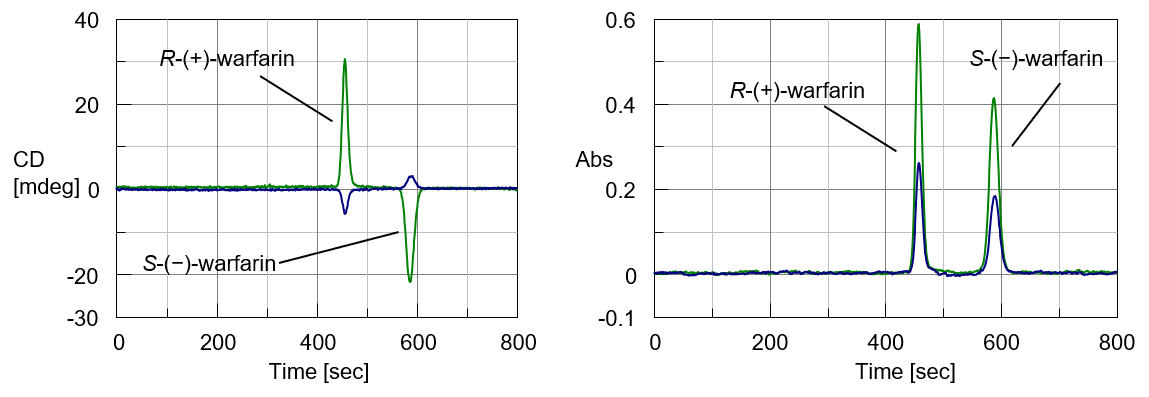
Figure 2. CD and absorption chromatograms of warfarin (Green: chromatogram detected at 220 nm, Blue: chromatogram detected at 263 nm)


 properties of platinum complexes using a CPL measurement system and a spectrofluorometer")
