Introduction
For qualitative analysis of an unknown sample based on the spectrum measured by Fourier transform infrared (FT-IR) spectroscopy, a search using a library (referred to as a “library search”) is typically performed. However, the library search may result in multiple spectra with similar shapes, and the final judgment must be made by analysts themselves. In order to identify the sample correctly, knowledge of spectral interpretation is required, which is a major obstacle for inexperienced analysts.
Therefore, JASCO has developed the [Advanced Spectra Search] program, which incorporates the expertise of a skilled analyst into software using machine learning. In addition to the search functionality of a typical spectrum library, this program has a machine-learning-based Classification function. This function classifies each compound based on its spectral shape, and the unique key bands for each compound are shown on the spectrum to assist in interpreting the spectrum.
[Advanced Spectra Search] program
The ADSS-4X [Advanced Spectra Search] program performs both Classification and Search for sample spectra. Simply opening the measured spectrum of an unknown sample and clicking the Run button performs Classification and Search at the same time. The results for Classification and Search can be compared by clicking the tabs.
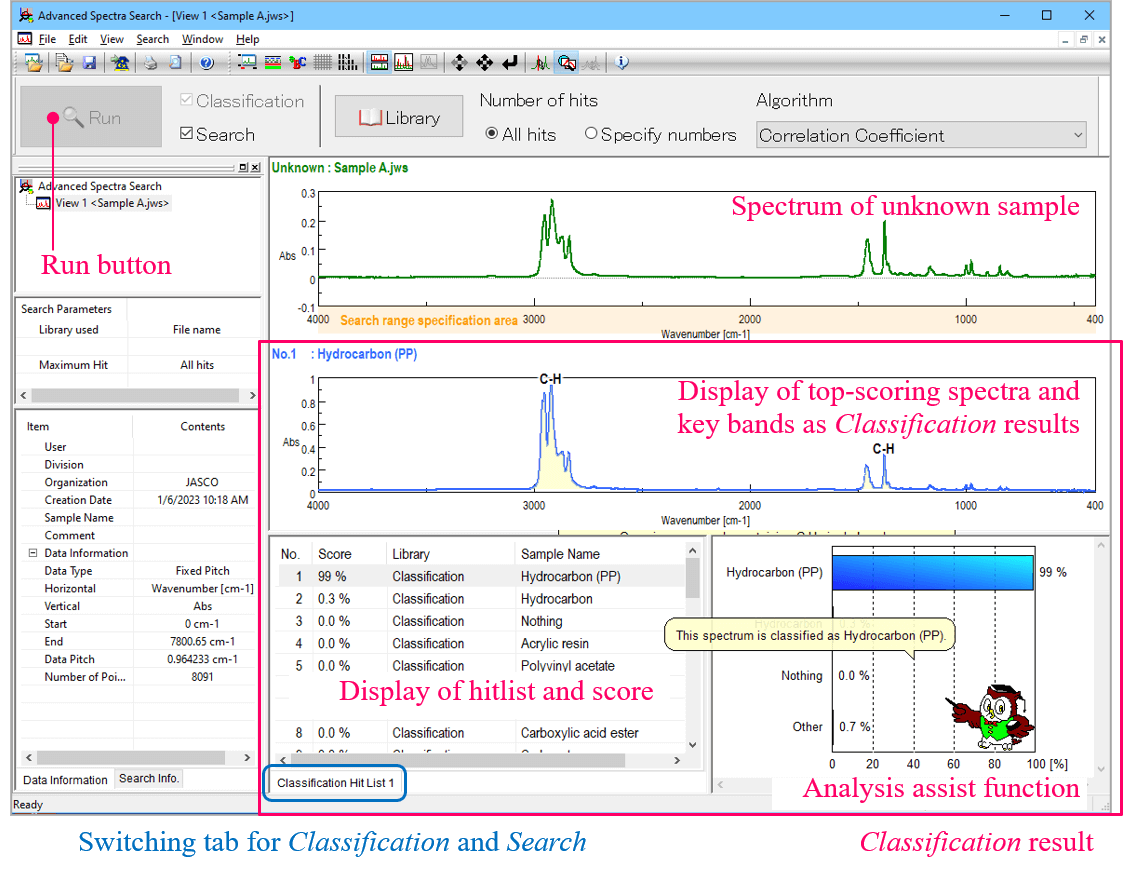
Fig. 1 Classification results in [Advanced Spectra Search] program
Classification
Classification is based on machine-learning results for approximately 10,000 spectra, and it classifies sample spectra into 35 categories (Table 1). Since this program focuses on foreign substances and polymers, it is particularly powerful for analyses of such samples. The program has also learned the changes that occur in spectra due to the measurement method and whether or not a pretreatment was used, so acquired spectra can be used without the need for data processing. In addition to being able to estimate the type of substance based on the classified categories, key bands specific to each compound are displayed, allowing the user to visually evaluate the validity of the results. Furthermore, the program also provides explanations for categories, and an analysis-assist function to help with interpreting the results (Figure 2).
Table 1 Classification categories
| Carboxylic acids | Silicone | Urethanes |
| Carboxylic acid salts | Epoxy resins | Silica |
| Carboxylic acid esters | Polyethers | Silica (talc) |
| Carboxylic acid esters (oil) | Polyethers (polyacetal) | Silica (kaolin) |
| Proteins | Fluorides | Carbonates |
| Polyamides | Styrene | Sulfates |
| Cellulose and sugar | Polycarbonates | Polyimides |
| Hydrocarbons | Nitriles | Phosphates |
| Hydrocarbons (polyethylenes) | Phenolic resins | Water |
| Hydrocarbons (polypropylenes) | Polyvinyl acetates | Acetone |
| Acrylic resins | Polyvinyl chlorides | Alcohol |
| Polyesters | Polyvinyl alcohol |
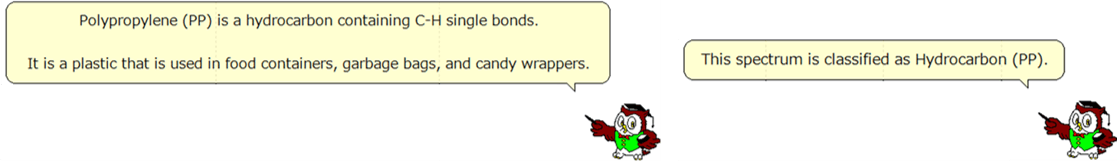
Fig. 2 Example of analysis-assist function
Search
Search uses libraries to search for spectra, similar to the KnowItAll*1 spectral databases or the JASCO [Spectra Search] program. The match rate (score) is calculated for the selected search method and the results can be displayed in descending order of score. Libraries of about 600 registered spectra, mainly of foreign substances and polymers, are available as standard. It is also possible to search for spectra using original libraries created using acquired spectra.
*1: KnowItAll is a trademark of John Wiley & Sons, Inc. in certain jurisdictions.
Case study for Classification
Polypropylene (PP) was measured using an ATR accessory, assuming a foreign materials analysis, which is frequently conducted on FT-IR spectroscopy. After measuring a spectrum (upper blue spectrum in Figure 3), we artificially added noise (lower red spectrum) in order to consider the case where the sample did not contact to the ATR crystal sufficiently due to the sample hardness, shape, or size, and that there is still an atmospheric influence. The results of Classification for the two spectra showed that “hydrocarbons (PP)” was top ranking in both cases, although the scores were different. Since the shape of the key band is clearly visible, both spectra are classified as “hydrocarbons (PP)”. Thus, even spectra containing noise could be correctly classified by focusing on key bands*2 (Figure 3).
*2: If the noise peaks are large or the noise overlaps with a key band, the spectrum may not be classified correctly.
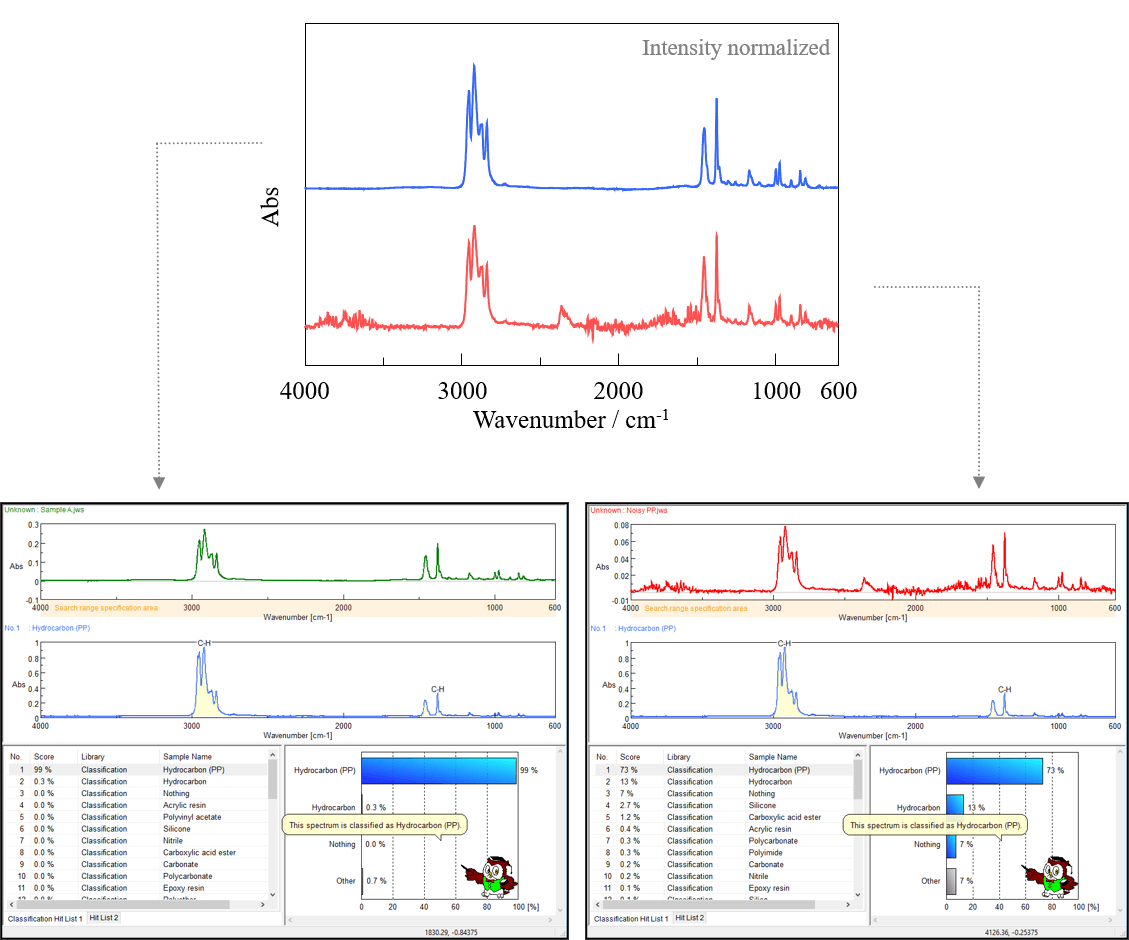
Fig. 3 IR spectra with different noise levels and Classification results
Keywords
Machine-learning, Qualitative analysis, Polymer, polypropylene, Advanced Spectra Search
Conclusion
The Classification function in the [Advanced Spectra Search] program provides information about key bands to focus on during qualitative analysis, in addition to estimating the type of substance based on classified categories. The classification and key-band information make it easier to determine the validity of the search results.
Related Posts:
 Identification of Degraded Plastics Cross-checking…
 Comparison of Separation Behavior among Silica-based…
 Evaluation of Higher-Order Structure and Stability…
 Vibrational Circular Dichroism Spectrometer based on…
 Evaluation of Degree of curing for Epoxy Resins…
 Can the JASCO Palmtop Raman spectrometer perform a…