Introduction
CD spectroscopy is generally considered an essential tool for the secondary structure analysis of proteins. The region typically measured for secondary structure estimations is around 260 nm and into the vacuum-UV region. However, the use of water as a solvent creates significant limitations due to its strong absorbance in the vacuum-UV region. Using H2O dramatically increases the absorbance around 175 nm and substituting in D2O only decreases the absorbance to 170 nm. Therefore, in order to analyze protein secondary structure in the vacuum-UV region, measurements require an instrument with a high signal-to-noise (S/N) ratio and a wide dynamic range to obtain quality data.
The J-1500 CD spectrometer has been designed specifically for measurements with high S/N in the vacuum-UV region. JASCO has incorporated several new technologies, including a new electronic system with digital lock-in signal processing, a wide dynamic range detector, high-throughput optics, and a highly effective low-flow nitrogen gas purging system.
In this application note, the vacuum-UV CD spectrum was obtained for a protein sample in order to estimate the secondary structure using the J-1500 CD spectrometer and multivariate SSE program (JWMVS-529).
J-1500 CD spectrometer
Experimental
Measurement conditions
Data acquisition interval: 0.1 nm
Spectral bandwidth: 1 nm
Accumulations: 4 times
Response time: 2 sec
Scan speed: 50 nm/min
Path length: 0.1 mm
Keywords
J-1500, circular dichroism, vacuum-UV region, secondary structure estimation (SSE), CD multivariate SSE, biochemistry
Results
A CD spectrum, each reflecting a specific secondary structure was obtained for three different protein motifs down to 174 nm. 0.1 mg/mL of human serum albumin (HSA) (green), concanavalin A (blue), and trypsin inhibitor (red) in water are shown in Figure 1. HSA is rich in α-helical structure, concanavalin A shows a β-sheet structure, and trypsin inhibitor has a random coil secondary structure.
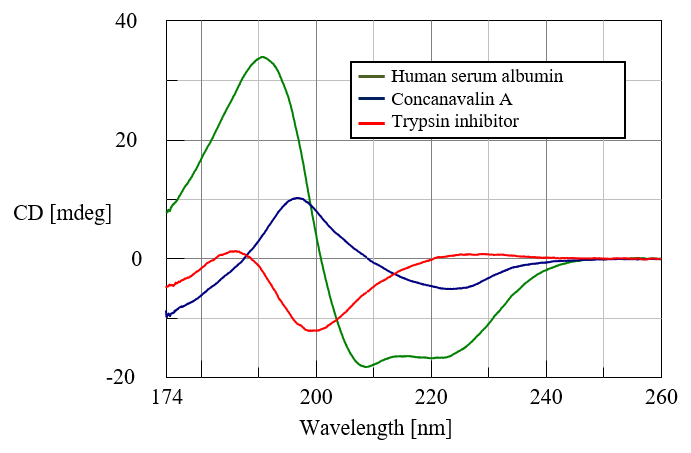
Figure 1. CD spectra of human serum albumin, concanavalin A, and trypsin inhibitor in the vacuum-UV region
Secondary structure estimation
The secondary structure estimation for each protein spectrum was performed using the multivariate SSE program (JWMVS-529) and the results are shown in Table 1, along with the X-ray crystal structure analysis and the CDSSTR method for comparison. Secondary structure determination using CD spectroscopy is generally considered less accurate for β-sheet motifs than for helical structures. However, the data in Table 1 clearly demonstrates the strong correlation for the β-sheet motif between the multivariate SSE program calculation and the results from the X-ray crystallography data. This improvement was achieved by using a PLS/PCR multivariate analysis method with a calibration model that was generated using a reference data set of CD spectra between 260-176 nm for 26 standard proteins.
Table 1.Secondary structure estimations using the JWMVS-529 multivariate program, X-ray crystallography data, and the CDSSTR program.
| Helix (%) | β-sheet (%) | Turn (%) | Random (%) | ||
|---|---|---|---|---|---|
| Human serum albumin | X-ray1 | 71.8 | 0.0 | 8.2 | 20.0 |
| Jasco2 | 70.6 | 0.0 | 9.4 | 20.0 | |
| CDSSTR3 | 71.1 | 0.0 | 6.9 | 22.9 | |
| Concanavalin A | X-ray | 3.8 | 46.4 | 10.5 | 39.2 |
| JASCO | 9.7 | 42.7 | 10.4 | 37.2 | |
| CDSSTR | 6.1 | 35.3 | 12.0 | 46.6 | |
| Trypsin inhibitor | X-ray | 1.7 | 33.1 | 10.5 | 54.7 |
| JASCO | 1.0 | 35.8 | 14.6 | 48.6 | |
| CDSSTR | 5.1 | 17.5 | 16.2 | 59.5 |
1) The secondary structure estimation by X-ray crystal structure analysis referred to can be found in the RCSB PDB. The PDB IDs are as follows: HSA (1bm0), concanavalin A (2ctv), and trypin inhibitor (1ba7).
2) The JASCO multivariate SSE program (JWMVS-529) used the following PLS/PCR methods: HSA (PLS), concanavalin A (PLS), and trypsin inhibitor (PCR).
3) The CDSSTR method used reference spectra SP22X[H,3/10, S, T, P2, U]178-260 nm.
Conclusion
This application note demonstrates that the J-1500 CD spectrometer provides good signal-to-noise ratio and wide dynamic range in order to obtain quality data on protein samples in H2O in the vacuum-UV region. The secondary structure estimations that were calculated from the CD data were in good agreement with calculations made from X-ray crystallography data and the CDSSTR program.


