Introduction
< Key Points >
By combining a JASCO CD spectrometer with the BeStSel program, the effect of inhibitors on the formation of amyloid fibrils can be assessed in a rapid and simple manner.
When amyloid β-peptides aggregate, amyloid fibrils are formed, predominantly with a parallel β-strand structure (Figure 1). The accumulation of these fibrils is considered to be a cause of neurodegenerative diseases such as Alzheimer‘s disease (AD) and Parkinson’s disease (PD).1) Therefore, the development of agents that inhibit the formation of amyloid fibrils is attracting attention. The use of a fluorescent labeling agent is a well-known method for assessing fibril formation.2,3) However, using this method, there is concern that the labeling agent itself may affect the formation of amyloid fibrils and the activity of the inhibitor.
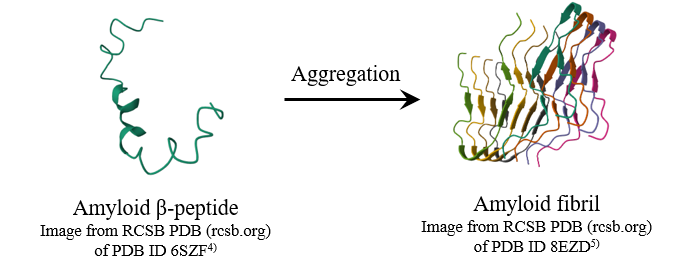
Fig. 1 Schematic images of amyloid β-peptide and amyloid fibril
Circular dichroism (CD) spectroscopy is a rapid and simple method for assessing the higher order structure (HOS) of peptides and proteins in solution, without the need for fluorescent labeling. Therefore, CD measurements of amyloid-β peptides can be used to monitor changes in the HOS and the formation of amyloid fibrils for the development of effective therapeutic and prophylactic agents. Here, we report the results of assessing the effects of three ionic liquids as inhibitors for amyloid fibril formation by combining CD spectroscopy with the BeStSel program*, which enables highly accurate and detailed secondary structure analysis.
* The JASCO Spectra Manager 2.5 BeStSel program was developed in collaboration with Dr. József Kardos and Dr. András Micsonai at ELTE.
Experimental
<Sample>
- Amyloid β-peptide
Amyloid β-protein (human, 1-42) (Peptide Institute. Inc.)
Asp-Ala-Glu-Phe-Arg-His-Asp-Ser-Gly-Tyr-Glu-Val-Hls-His-Gln-Lys-Leu-Val-Phe-Phe-Ala-Glu-Asp-Val-Gly-Ser-Asn-Lys-Gly-Ala-lle-lle-Gly-Leu-Met-Val-Gly-Bly-Val-Val-lle-Ala
- Ionic liquids (Tokyo Chemical Industry Co., Ltd.)
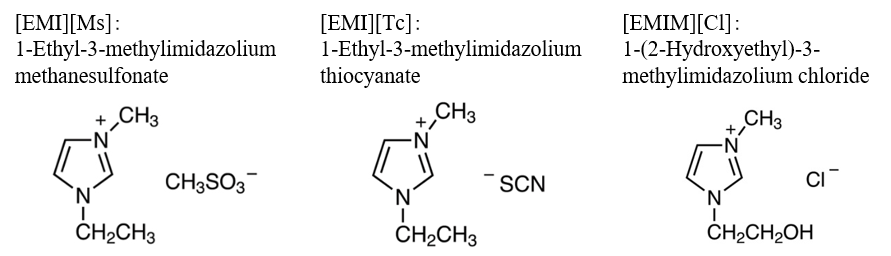
Fig. 2 Chemical structure of ionic liquids
<Procedure>
Amyloid β-peptide was dissolved in 67-mM phosphate buffer (pH 7.0), and 400 μL of the solution was injected into a cell with a path length of 1 mm. CD spectra were then measured for 400 min at 20-min intervals for samples with and without ionic liquids. The ionic liquids were added dropwise just before the measurement. The final concentrations of amyloid β-peptide and ionic liquid were adjusted to 25 μM and 0.005%, respectively.
<System>
Instrument: J-1500 CD spectrometer
Accessories: PTC-510 Peltier thermostatted single cell holder, CTU-100 Circulating Thermostat Unit
Software: Interval scan program, JWBeStSel-532 BeStSel program
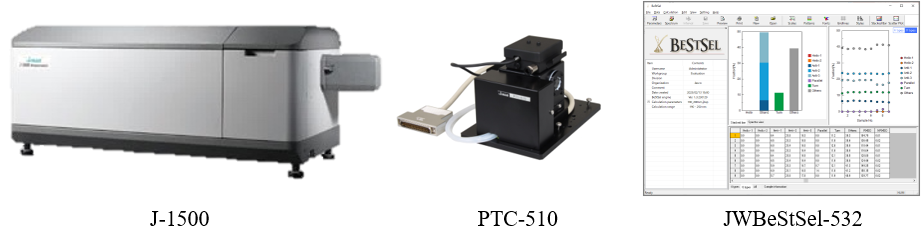
Fig. 3 Images of measurement system
<Parameters>
Bandwidth: 1 nm
Scanning speed: 50 nm/min
Response (D.I.T): 2 sec
Data interval: 0.1 nm
Path length: 1 mm
Holder temperature: 37 °C
Keywords
Amyloid, Amyloid β-peptide, Inhibitor, Ionic liquid, Finke-Watzky model, Circular dichroism, BeStSel, Higher order structure, HOS, Secondary structure
Results
<Effects of ionic liquids>
The change in the CD spectrum of amyloid β-peptide over time in the absence or presence of an ionic liquid was monitored using a CD spectrometer (Figure 4, upper panels). Time course data for the CD signal at 217 nm derived from the β-strand structure are shown in the lower panels. The results show that in the absence of an ionic liquid, this CD signal decreased over time (Figure 4A, lower panel). By comparison, in the presence of [EMI][Ms], the initial rate of change was smaller, indicating that [EMI][Ms] inhibits the formation of the β-strand structure in the initial stage (Figure 4B, lower panel). In contrast, in the presence of [EMI][Tc] or [EMIM][Cl], the initial rate of change was larger than that in the absence of an ionic liquid, indicating that these ionic liquids actually promote the formation of the β-strand structure in the initial stage (Figures 4C,D, lower panels).
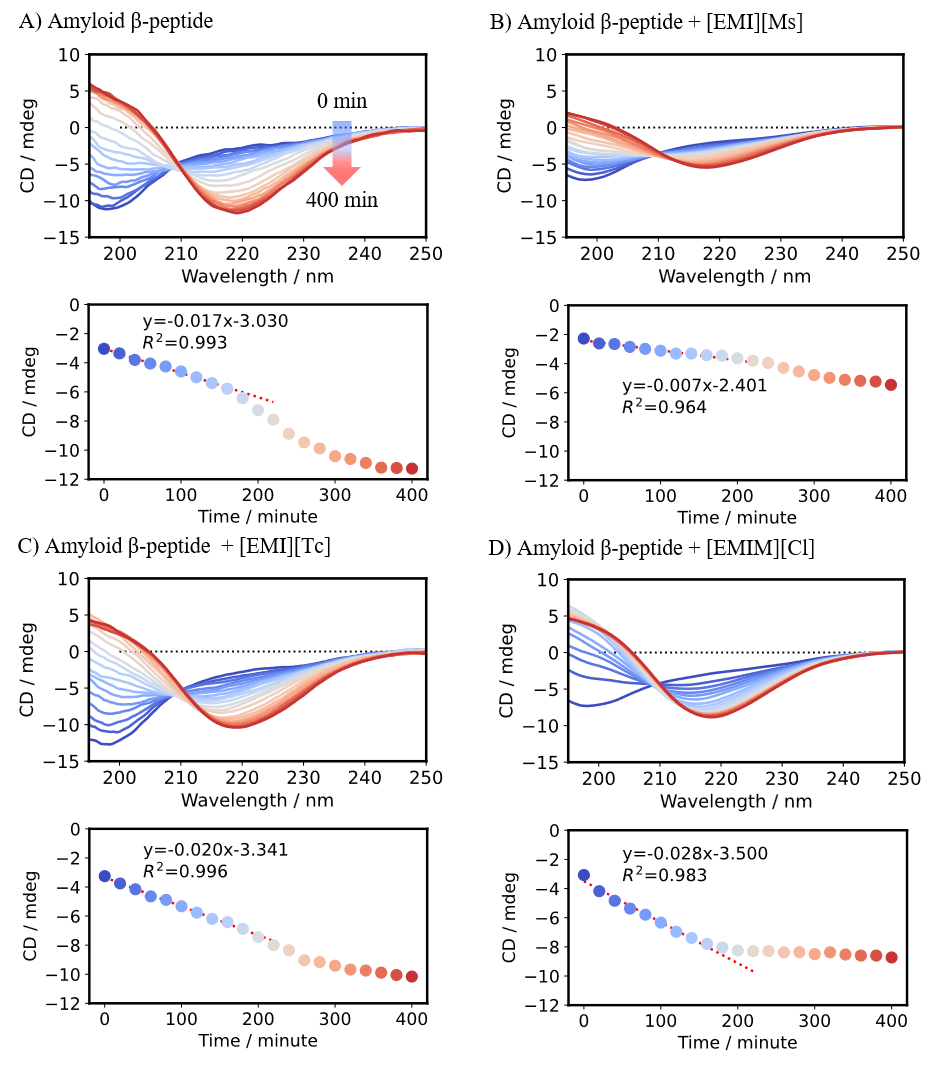
Fig. 4 CD spectra of amyloid β-peptide in absence or presence of ionic liquids (upper panels) and time course of CD signal at 217 nm (lower panels)
<Secondary structure analysis using the BeStSel program>
Using the BeStSel program, it is possible not only to classify peptide and protein secondary structures into four types (helix, strand, turn, and others), but also to classify strand structures into parallel β-strands and three types of antiparallel β-strands. Figure 5 shows the results of a secondary structure analysis of the CD spectra in Figure 4 using the BeStSel program to obtain the fraction of parallel β-strands, which are the dominant structure during amyloid fibril formation. The results indicate that [EMI][Ms] inhibits the formation of parallel β-strands.
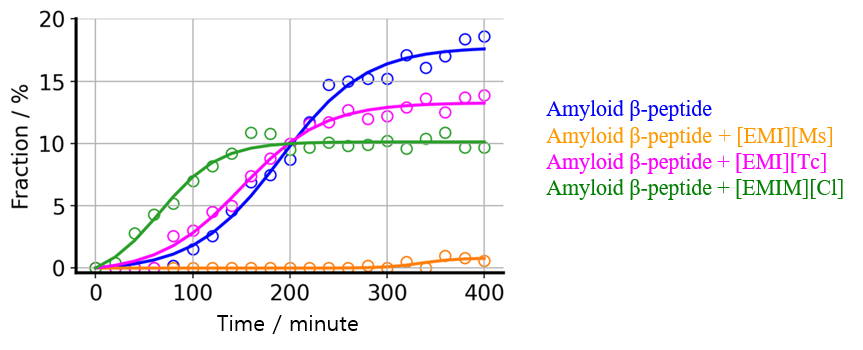
Fig. 5 Changes over time in fraction of parallel β- strands in absence or presence of ionic liquids (markers) and fitting results obtained using Finke-Watzky model (solid lines).
The Finke-Watzky model is a reaction model used to describe the process of amyloid fibril formation.6) This model posits that fibrillogenesis proceeds via a biphasic mechanism: an initial nucleation phase, during which monomeric amyloid β-peptides undergo association to form an oligomeric nucleus, followed by an elongation phase, wherein the preformed nucleus acts as a template for the sequential addition of monomers, driving the elongation of amyloid fibrils (Figure 6). This model is expressed by Equations (1) and (2).
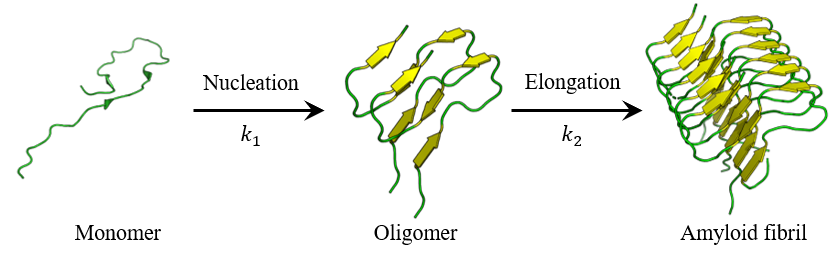
Fig. 6 Nucleation and elongation phases in Finke-Watzky model

A fitting analysis was then performed using the Finke-Watzky model on the time course data for parallel β-strands (Figure 5), and the rate constants k1 and k2 were calculated (Table 1). The results show that the model is in good agreement with the experimental data. In the presence of [EMI][Ms], the value of k1 is 0.0, indicating that nucleation is completely inhibited. On the other hand, comparing k1 and k2 in the presence of [EMI][Tc] and [EMIM][Cl] to the corresponding values in the absence of an ionic liquid, the change in k1 is larger than that in k2, suggesting that these ionic liquids primarily promote nucleation and induce amyloid fibril formation.
Table 1 Rate constants obtained using Finke-Watzky model
| Sample | k1[10-4 min-1] | k2[10-3 mol-1 L min-1] |
| Amyloid β-peptide | 3.0 | 1.3 |
| Amyloid β-peptide + [EMI][Ms] | 0.0 | – |
| Amyloid β-peptide + [EMI][Tc] | 6.5 | 1.7 |
| Amyloid β-peptide + [EMIM][Cl] | 33.6 | 2.9 |
Conclusion
Using a CD spectrometer and the BeStSel program, which allows highly accurate and detailed secondary structure analysis, the inhibition effects of three ionic liquids on amyloid fibril formation were evaluated. The results show that [EMI][Ms] inhibits nucleation in the initial phase of amyloid fibril formation, while [EMI][Tc] and [EMIM][Cl] exhibit nucleation-promoting effects. These results demonstrate that CD spectroscopy allows rapid and simple assessment of inhibition effects on amyloid fibril formation without the need for fluorescent labels.
References
1)J. Hardy, K. Duff, K. G. Hardy, J. Perez-Tur, M. Hutton: Nat. Neurosci., 1, 355-358 (1998). DOI: 10.1038/1565
2)H. Naiki, K. Higuchi, M. Hosokawa, T. Takeda: Anal. Biochem., 177, 244-249 (1989). DOI: 10.1016/0003-2697(89)90046-8
3)C. Xue, T. Y. Lin, D. Chang, Z. Guo: R. Soc. Open. Sci., 4, 160696 (2017). DOI: 10.1098/rsos.160696
4)A. Santoro, M. Grimaldi, M. Buonocore, I. Stillitano, A. M. D’Ursi: Pharmaceuticals, 14, 732 (2021). DOI: 10.3390/ph14080732
5)M. Lee, W. M. Yau, J. M. Louis, R. Tycko: Proc. Natl. Acad. Sci. U.S.A., 120, e2218831120 (2023). DOI: 10.1073/pnas.2218831120
6)M. A. Watzky, R. G. Finke: J. Am. Chem. Soc., 119, 10382-10400 (1997). DOI: 10.1021/JA9705102
Acknowledgments
This work was performed under the guidance of Professor Takehiko Wada, Institute of Multidisciplinary Research for Advanced Materials, Tohoku University.


