Introduction
Thiuram is a type of thiocarbamate fungicide widely used as an agricultural chemical. The environmental standard for water pollution in public water bodies in the Basic Environment Law (Law No. 91, 1993, Article 16) sets the maximum acceptable concentrations of different substances [Please confirm.] for protection of human health and preservation of the living environment, and the concentration for thiuram is set at ≤0.006 mg/L.
Herein, we report the results of solid-phase extraction and HPLC measurement of thiuram in accordance with Appendix Table 5 of Notification No. 62 of the Ministry of the Environment.
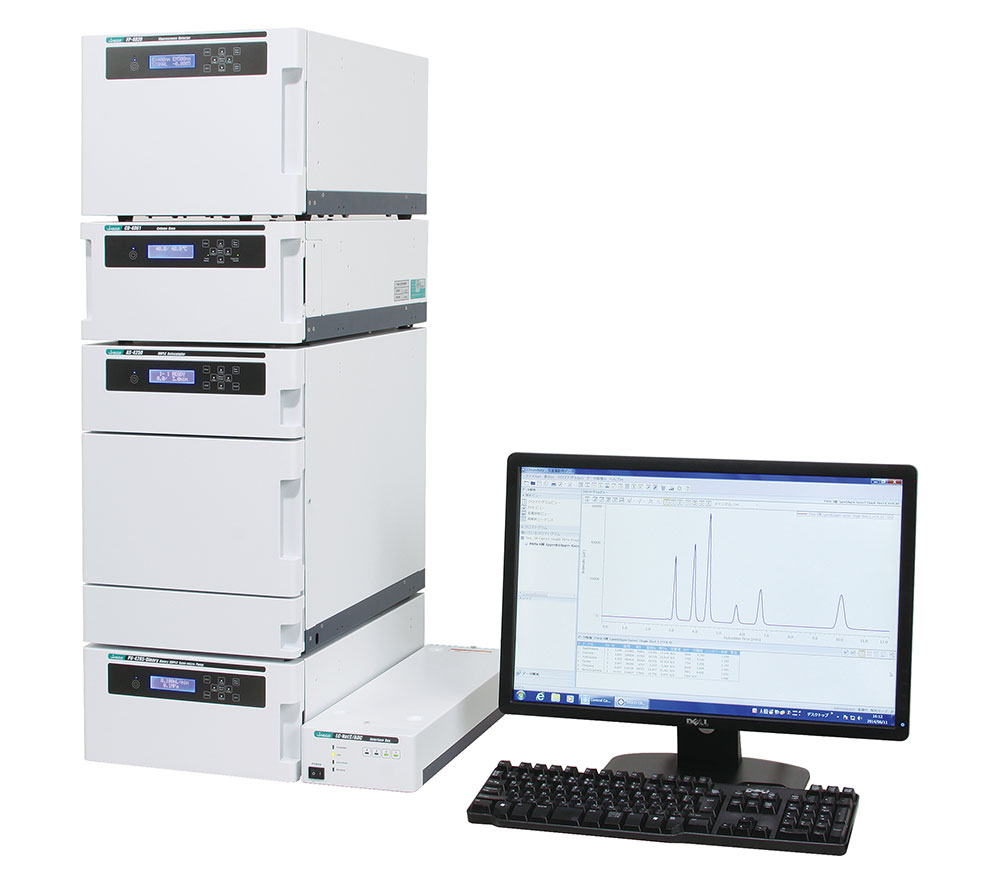
LC-4000 series HPLC system
Experimental
<Instruments>
Pump: PU-4180*
Autosampler: AS-4150*
Column oven: CO-4060
Detector: UV-4075
* with option units
<Conditions>
Column: Unifinepak C18 (4.6 mmI.D. x 150 mmL, 5 µm)
Eluent : Acetonitrile/50 mM potassium dihydrogen phosphate (adjusted to pH 3.0 with phosphoric acid) (55/45)
Flow rate: 1.0 mL/min
Column temp.: 40 ºC
Wavelength: 272 nm
Injection volume: 20 µL
Standard: Thiuram in acetonitrile
(Refer to each data for concentrations.)
<Structure>

Thiuram
Keywords
Thiuram, Unifinepak C18, UV detector, water quality analysis, solid-phase extraction
Results
(1) System performance test
As a system performance test, a standard solution of thiuram was prepared and measured. Figures 1 and 2 show chromatograms (n = 6) of 1.0 mg/L and 0.1 mg/L thiuram standard solutions, and Tables 1 and 2 show the reproducibility of the retention time and peak area, respectively, which confirm that good reproducibility was obtained in both cases.
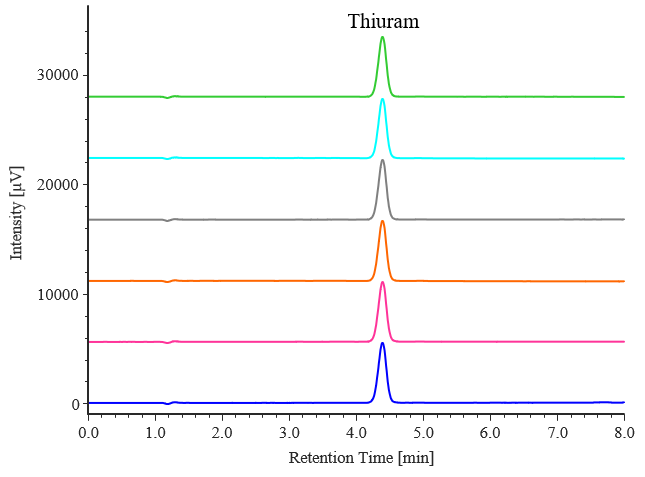
Fig. 1 Chromatograms of thiuram standard solutions (1.0 mg/L, n = 6)
Table 1 Retention time and peak area reproducibility of thiuram (1.0 mg/L, n = 6)
| Injection number | Retention time [min] | Peak area |
| 1 | 4.392 | 47211 |
| 2 | 4.400 | 47261 |
| 3 | 4.400 | 47164 |
| 4 | 4.400 | 47186 |
| 5 | 4.400 | 47260 |
| 6 | 4.400 | 47288 |
| Ave. | 4.399 | 47228 |
| SD | 0.003 | 49 |
| RSD[%] | 0.077 | 0.103 |
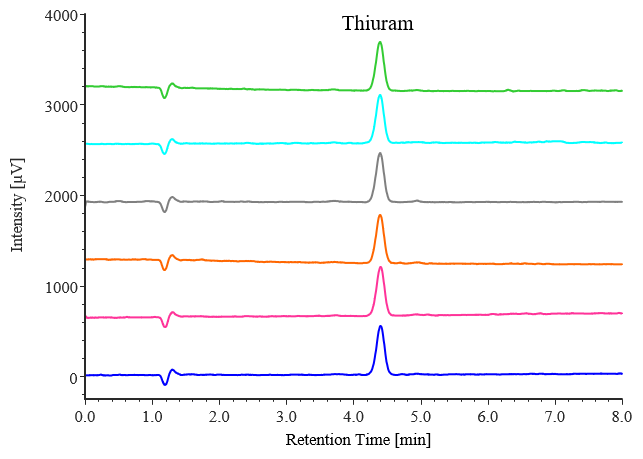
Fig. 2 Chromatograms of thiuram standard solutions (0.1 mg/L, n = 6)
Table 2 Retention time and peak area reproducibility of thiuram (0.1 mg/L, n = 6)
| Injection number | Retention time [min] | Peak area |
| 1 | 4.400 | 4595 |
| 2 | 4.400 | 4590 |
| 3 | 4.400 | 4579 |
| 4 | 4.400 | 4601 |
| 5 | 4.392 | 4574 |
| 6 | 4.392 | 4576 |
| Ave. | 4.397 | 4586 |
| SD | 0.004 | 11 |
| RSD[%] | 0.098 | 0.243 |
(2) Confirmation of linearity of calibration curve
Figure 3 shows the measurement results of five standard solutions prepared in the concentration range of 0.1 to 1.0 mg/L as specified by the Basic Environmental Law. The correlation coefficient for the calibration curve of peak area against concentration was r ≥ 0.9999, indicating good linearity (Fig. 4).
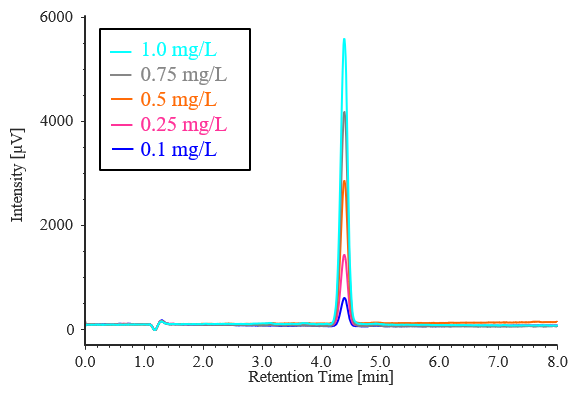
Fig. 3 Chromatograms of thiuram standard solutions (0.1, 0.25, 0.5, 0.75, 1.0 mg/L, n = 6)
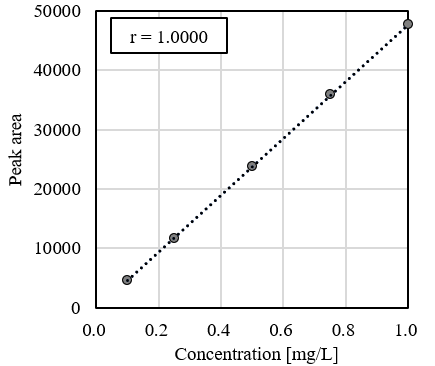
Fig. 4 Linearity of calibration curve for thiuram standard solutions
(3) Pretreatment method using solid-phase extraction columns
Solid-phase extraction, one of the pretreatment methods for thiuram specified in the Basic Environmental Law, defines a procedure whereby thiuram is concentrated 500 times. An example of the pretreatment procedure is shown in Figure 5.
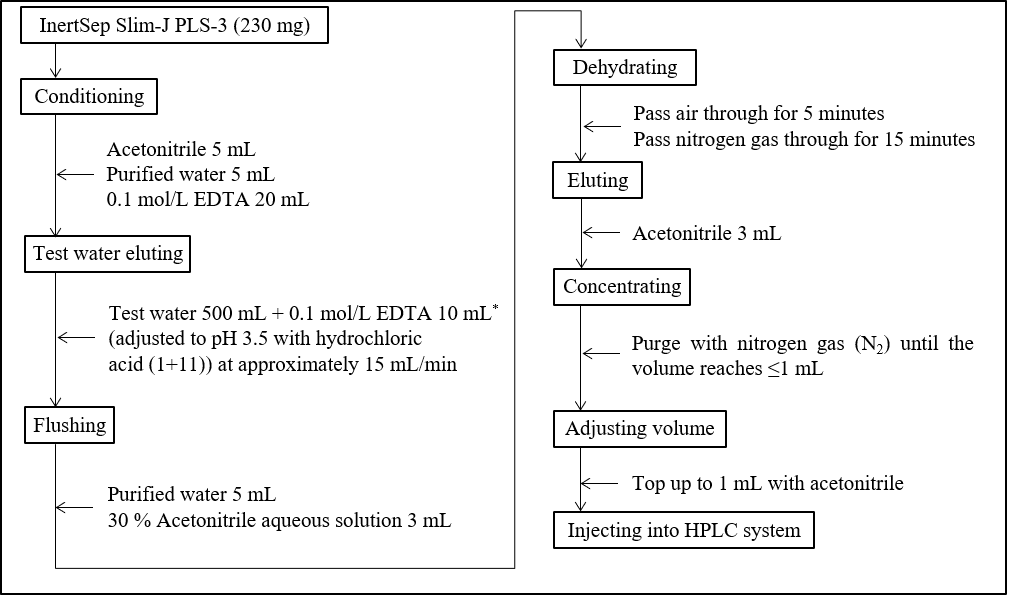
Fig. 5 Procedure for concentrating test water by solid-phase extraction (500 times concentration)
* EDTA added to inhibit the formation of complexes between the metal and thiuram in water and prevent a decrease in the recovery rate.
In this test, a 0.0006 mg/L thiuram solution, which is 1/10 of the criterion, was concentrated 500 times by solid phase extraction and then measured twice. Figure 6 shows chromatograms for these extracted solutions, a 0.3 mg/L thiuram standard solution (equivalent to 500 times the concentration of 0.0006 mg/L), and a solution obtained by solid-phase extraction of 500 mL of purified water as a blank test. The recovery rate for the solid-phase extraction solution was ≥80% in both cases. In the blank test, if the peak height exceeds the quantitation limit of 0.20, the operation is performed again from the pretreatment step. At this time, the peak height was confirmed to be below the quantitation limit of 0.20.
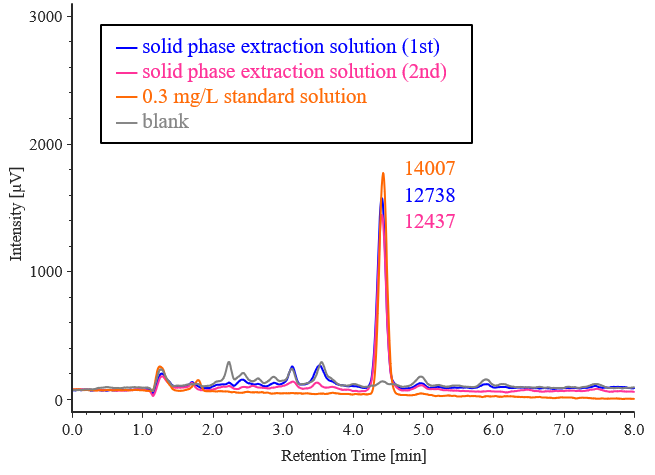
Fig. 6 Chromatogram of thiuram solutions with solid-phase extraction (0.3 mg/L, Values in the figure are peak area values)
Table 3 Recovery rate for solid-phase extraction solution*
| Peak area | Recovery rate | |
| Standard solution | 14007 | – |
| Extraction solution (1st) | 12738 | 90.9 % |
| Extraction solution (2nd) | 12437 | 88.8 % |
* (Extraction solution peak area) / (standard solution peak area) x100
Table 4 Ratio of peak height to limit of quantitation in blank test
| Peak height [μV] | |
| Blank | 21 |
| Limit of quantitation *1 | 122 |
| Ratio *2 | 0.17 |
*1 Calculated as 10 times the noise level
*2 Calculated as (Peak height) / (limit of quantitation)


")
