Many traditional spectroscopies have been adapted to microspectroscopy. Techniques widely used in microspectroscopy of samples are ultraviolet-visible absorption, fluorescence, Raman scattering and infrared absorption (Table 1). The ultraviolet-visible absorption method measures absorbance of a sample and is suitable for obtaining a color spectrum in the visible region. In the fluorescent probe method, light emission by fluorescent molecules under excitation light is measured. This method may require fluorescence staining of the sample. Infrared absorption by a sample are measured using infrared absorption based on molecular vibrations, which are unique to every compound. Raman scattering measures molecular vibrations similar to infrared but using lasers in the visible and near-infrared regions. A Raman scattering microscope has high spatial resolution but the signal intensity is low, so that measurements can require a long time. Although an infrared absorption microscope has high sensitivity, it is difficult to obtain high spatial resolution. Raman and infrared are considered complimentary techniques.
Table 1. Types and features of microspectroscopy
| Type | Principles | Phenomena | Uses | Features |
|---|---|---|---|---|
| Ultraviolet-visible | Electronic transitions | Transmission / reflection | Optical materials | Hue of observed image matches visible spectrum |
| Paints | ||||
| Color analysis | ||||
| Fibers | ||||
| Forensics | ||||
| Fluorescence | Electronic transitions | Emission | Autofluorescence | Visualizing localization of luminescent molecules with high contrast |
| Fluorescent probes | ||||
| Biomaterials | ||||
| Quantum yield | ||||
| Infrared | Molecular vibrations | Transmission / reflection | Foreign matter | Analysis of effects of factors such as temperature, electric field and light irradiation on sample state |
| Multilayer films / film thickness | ||||
| Fillers | ||||
| Device failure | ||||
| Reaction process | ||||
| In-plane distribution | ||||
| Orientation | ||||
| Component distribution | ||||
| Raman | Molecular vibrations | Raman scattering | Fine particles | Using a confocal optical system, 3D imaging is possible by performing a scanning analysis in the depth direction. |
| Buried foreign matter | ||||
| Silicon stress | ||||
| Crystal polymorphs | ||||
| Compound semiconductors | ||||
| Inorganic materials | ||||
| Pharmaceuticals / cosmetics |
Spatial resolution in microspectroscopy
There are two types of objective optics for microspectroscopy: visible objective lenses and Cassegrain mirrors, and the type used depends on the purpose (Figure 1). For UV-Vis, fluorescence, and Raman objectives found in common microscopes may be used. For FTIR Cassegrain objectives are required. Spatial resolution is important to microspectroscopy since it determines how small of features you can see. In the case of an objective lens, the spatial resolution is 0.61 × λ/N.A., and for a Cassegrain mirror, it is 2.2 × λ/N.A., where N.A. is the numerical aperture and λ is the wavelength of light. Thus, the spatial resolution is theoretically higher for an objective lens. Spatial resolution also increases with decreasing wavelength. Table 2 summarizes the minimum observable area for different microspectroscopy methods.
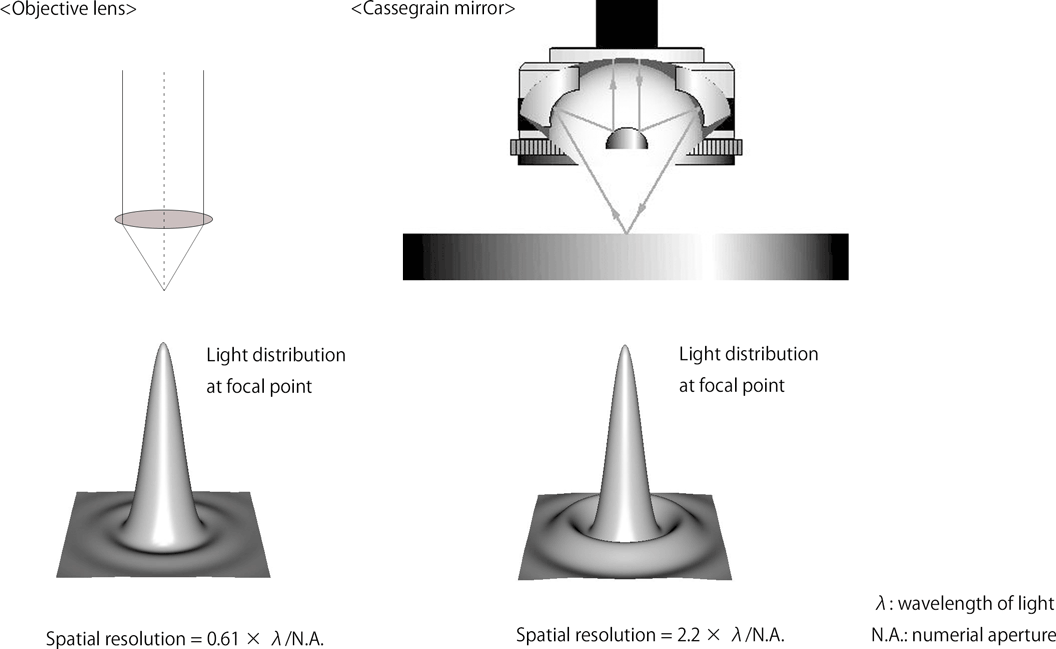
Figure 1. Objective lens and Cassegrain mirror
Table 2. Types of microspectroscopy and observable areas
| Type | Condensing system | Minimum size | Issues | Features |
|---|---|---|---|---|
| Ultraviolet-visible/fluorescence | Cassegrain mirror / objective lens | 10 μm | Absorption / staining | |
| Infrared | Cassegrain mirror | 5 μm | Sample thickness | Thin film preparation |
| Use of ATR | ||||
| Raman | Objective lens | 1 μm | Fluorescence | Excitation wavelength selection |
| Fluorescence removal |
Mapping and imaging
Creating a spectroscopic image of a sample may be done by either mapping or imaging a sample. First, a visual image of the sample must be obtained. In recent microspectroscopy systems, visual CCD imaging is performed instead of visual observation with an eyepiece. The magnification of the image is determined by the objective lens, and the sample position is adjusted by an XY stage to set the field of view. Mapping is performed by automatically scanning a target area in the visual image and performing measurements at multiple points. These points form individual pixels in a spectroscopic image. Imaging can also be performed by simultaneously measuring multiple points using a linear array CCD detector for UV-Vis, fluorescence, and Raman and a linear array MCT for FTIR (Figure 2). The spectroscopic image can be formed based on selecting a desired wavelength and examining the intensity of the peak at the points on the image.
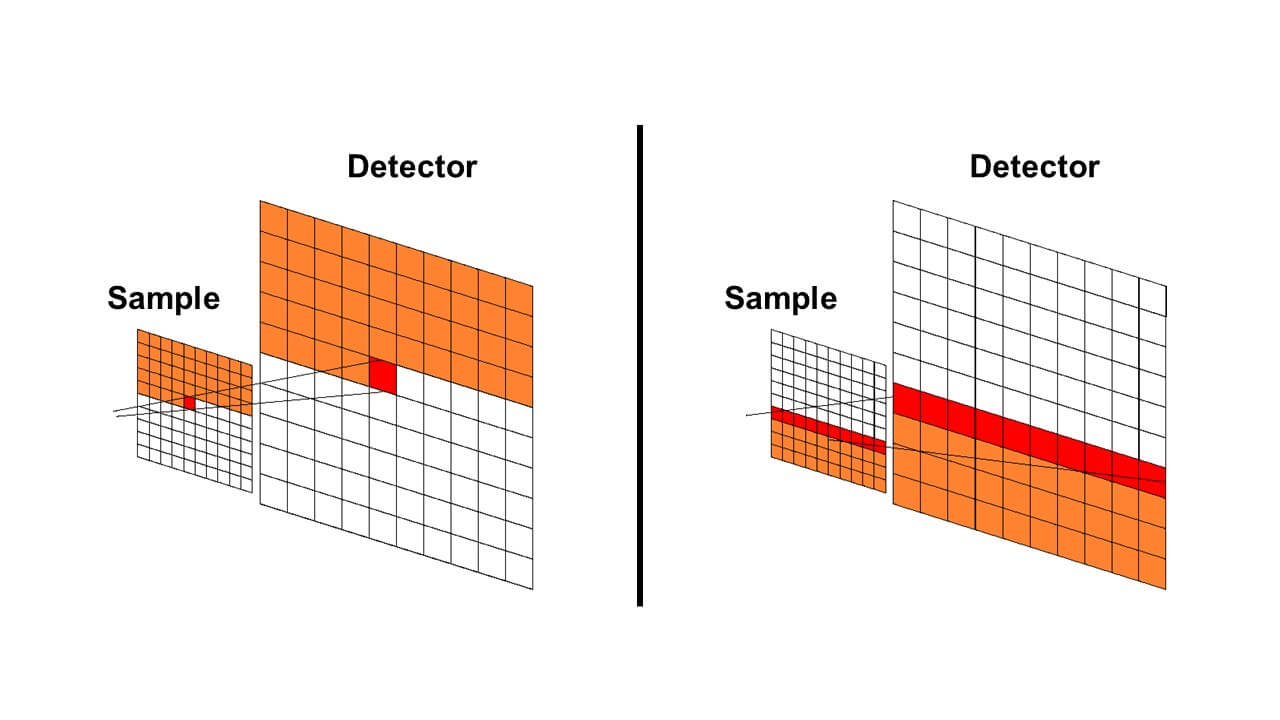
Figure 2. Mapping vs. Imaging


