Interferogram and IR spectrum
In FTIR spectroscopy, an interference wave is synthesized from two beams separated by a beam splitter, the detected interference waveform (interferogram) is Fourier-transformed, and a spectrum is obtained by separating each wavenumber. Fig. 6 shows an overview of the conversion of an interferogram for bichromatic light into an IR spectrum.
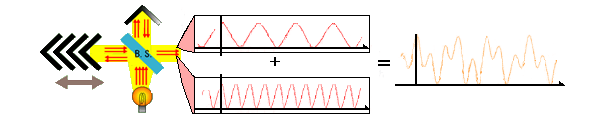
Fig. 6 Output signal of interference wave in FTIR
How does the interferometer work?
Monochromatic light is a superposition of waves of the same frequency. The light intensity is a maximum when all of the individual waves have the same phase, and decreases as the phase difference becomes larger. In a FTIR spectrometer, this phase difference is varied using a mirror that moves at a constant speed, together with a dual light path. For a monochromatic light source, a plot of the detected light intensity against time (mirror movement distance) appears as a sinusoidal wave, as seen in the upper row of Fig. 7. Taking a Fourier transform of this waveform produces a single peak at the frequency of the monochromatic light.
In the case of bichromatic light, containing components with two different frequencies, a more complicated waveform is produced. When this is subjected to a Fourier transform, it produces two peaks corresponding to the two frequencies present, as seen in the middle row in Fig. 7.
For a continuous light source, its spectrum corresponds to a superposition of waves of different frequencies, all in phase with each other. Before the mirror is moved (when the time t = 0 ), there is no phase difference between the optical paths, and the light intensity at all wavenumbers is highest. However, as time passes (the mirror moves), destructive interference occurs and the signal strength gradually converges to zero. The resulting plot of signal intensity against time is referred to as an interferogram. By taking a Fourier transform of the interferogram, the original frequency spectrum can be calculated, as shown in the lower row in Fig. 7.
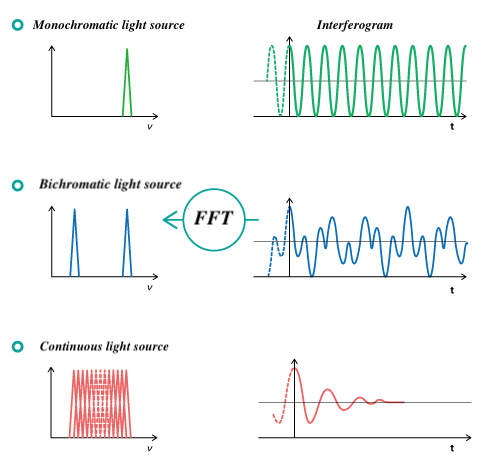
Fig. 7 Frequency spectrum obtained from interferogram
How an interferogram is acquired?
FTIR detectors observe interferograms as analog signals, but in order to perform a Fourier transform, a digital signal is needed. In a FTIR spectrometer, monochromatic light (632.8 nm) from a He-Ne laser is used, together with a moving mirror, and the intensity of the output interference signal is measured as a function of time. A He-Ne laser is a very stable monochromatic light source, and so it can accurately obtain an interferogram at equal intervals, which can be used to produce a spectrum with high wavenumber accuracy, as shown in Fig. 8.
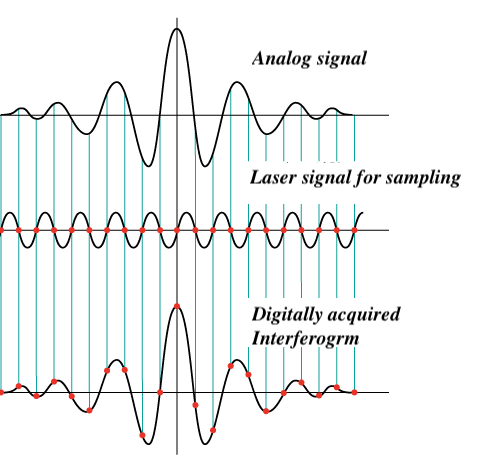
Fig. 8 Digital signal acquisition by interferometer


