Introduction
The Stopped Flow method is used to analyze reactions occurred during the duration of several milliseconds and several seconds meanwhile the CD measurement provides valuable information regarding the protein’s secondary structures and environment of aromatic amino acids. Therefore, CD measurement with Stopped-flow method provides one of the best techniques in analyzing the protein’s Unfolding and Refolding process.
Concanavalin A (derived from Jack bean) in natural state has abundant β-sheet structures, however, it is known that its structure changes into the one with rich α-helix under trifluoroethanol (TFE) and its Unfolding process has been reported also 1).
In this application, the model SFS-602 High-Speed Stopped-flow System was used to measure the Unfolding process of Concanavalin A under TFE.
J-1500 CD spectrometer
Experimental
Measurement parameters (Stopped Flow Measurement)
Syringe 1: 0.2 mg/ml, Concanavalin A, in hydrochloric acid (pH2)
Syringe 2: TFE
Mixing ratio: 100 µl:100 µlCD Spectra of Concanavalin A
Total flow rate: 10 ml/sec
Cell path length: 2 mm
Wavelength for measurement: 220 nm
Data pitch: 2 msec
Band width: 1 nm
Accumulation: 4 times
Results
CD Spectra of Concanavalin A
The Concanavalin A’s in pH2 hydrochloric acid gives a CD spectrum specific to b-sheet structure. In contrast, in a solution with 50% of TFE added it has a CD spectrum specific to α-helix structures. As seen in Figure 1, a big change from abundant β-sheet structure to abundant a-helix structure can be identified.
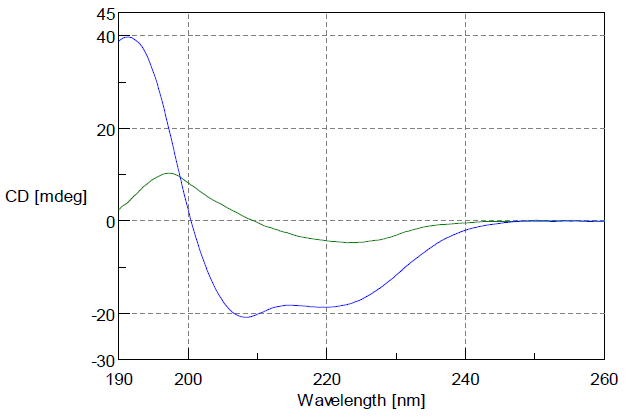
Figure 1: CD Spectrum of Concanavalin A
Green: CD spectrum of Concanavalin A in pH2 hydrochloric acid
Blue: CD spectrum of Concanavalin A in solution with 50% TFE
(Both are Concanavalin A: 0.1 mg/ml; cell path length: 1 mm)
Stopped Flow Measurement
Concanavalin A (0.2 mg/ml, in pH2 hydrochloric acid) was mixed with TFE with a ratio of 1:1 and its Unfolding process was measured using the Stopped Flow method. The CD value at 220 nm showed an increase in negative side, and change from abundant b-sheet structure to abundant a-helix structure was observed. By analyzing the reaction as a two-step reaction (A –> B –> C model) through the use of the Reaction Speed Calculation Program, unsurpassed fitting of the spectra was obtained (Figure 2).
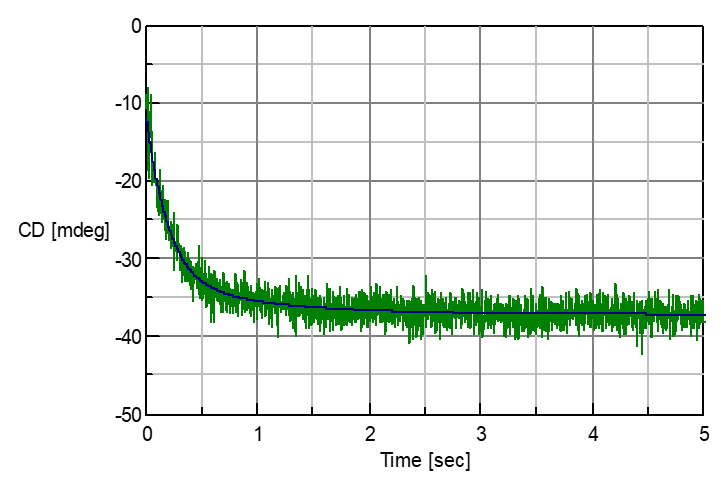
Figure 2: Unfolding process of Concanavalin A in TFE and analysis result
Result of Analysis
Reaction speed equation: Y(t)=20.5925*exp(-t/0.189295)+ 4.73648*exp(-t/0.903939)
Step 1 time constant: 0.189295 [s]
Step 1 speed constant (k1): 5.28275 [s-1]
Step 2 time constant: 0.903939[s]
Step2 speed constant (k2): 1.10627 [s-1]
References
(1) Qi Xu and Timothy A. Keiderling, (2005) Biochemistry, p.44, 7976-7987
Related Posts:
 Reaction Monitoring System using Surface-Enhanced…
 In-situ Raman Monitoring for Flow Synthesis of Peptide Drugs
 Analysis of CBN-Binding DNA Aptamer using CD Spectroscopy") Higher-Order Structure (HOS) Analysis of CBN-Binding…
Higher-Order Structure (HOS) Analysis of CBN-Binding… Higher Order Structure, Stability, and Similarity…
 Quantitation of Glucose in Aqueous Solution using…
 Monitoring Microbial Fermentation using Raman Spectroscopy