Introduction
DNA aptamers, which are single-stranded DNA oligonucleotides that specifically bind to target molecules such as proteins by forming higher-order structures (HOSs), are being studied for applications in biosensors and oligonucleotide therapeutics. DNA aptamers having sequences with high binding affinity and high specificity for target molecules are generally screened from DNA libraries through systematic evolution of ligands by exponential enrichment (SELEX). Using this approach, Yu et al. developed a DNA aptamer that binds specifically to (-)-trans-Δ9-tetrahydrocannabinol (THC) and cannabinol (CBN).1) THC and CBN are two of the more than 100 types of natural chemical components called cannabinoids found in the cannabis plant. While THC is regulated in many countries due to its highly psychoactive and addictive properties, CBN is a mildly psychoactive substance known to improve sleep and reduce inflammation.
Nucleic acids exhibit circular dichroism (CD) in the far-ultraviolet wavelength region based on the nucleotide backbone and bases. Therefore, CD spectrometers are widely used to evaluate the HOS of oligonucleotides. This report describes structural changes in the HOS for the CBN-binding DNA aptamer and the cross-reactivity of DNA aptamers with CBN and CBN analogs, cannabidiol (CBD) and cannabigerol (CBG), using the J-1500 CD spectrometer combined with a high-throughput CD measurement system (HTCD Plus), which can measure up to 192 samples in a single run.
Experimental
Sample
<DNA aptamer>
Figure 1 shows the structure of the CBN-binding DNA aptamer developed by Yu et al.1) This has a very high affinity for THC and is also known to bind CBN. It has a mixed structure of guanine quadruplex (G4) and double-stranded DNA. In this experiment, the DNA aptamer was prepared at a concentration of 0.2 mg/mL.
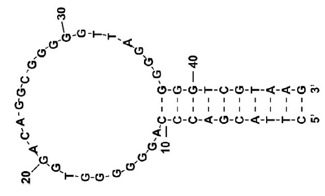
Fig. 1 Structure of CBN-binding DNA aptamer
<CBN and CBN analogs>

Fig. 2 Structure of three cannabinoids
<Buffer>
10 mM Tris, 10 mM MgCl2, 20 mM NaCl (pH 7.4)
System
Instrument: HTCD Plus high-throughput circular dichroism measurement system

Fig. 3 HTCD Plus high-throughput circular dichroism measurement system
Parameters
Sample volume: 120 mL
Path length: 1 mm
Scanning speed: 50 nm/min
D.I.T.: 2 sec
Bandwidth: 1 nm
Accumulations: 4
Flushing for flow system:
1st wash = 1% Hellmanex III (manufactured by Hellma)* 250 µL × 1;
2nd wash = ultrapure water 300 µL × 4;
3rd wash = ethanol 300 µL × 2; air drying = 60 sec
Keywords
Biosensor, oligonucleotide therapeutics, DNA aptamer, oligonucleotide, higher-order structure, G-quadruplex, cross-reactivity, circular dichroism, CD, cannabinoid
Results
Change in HOS of DNA aptamer with CBN concentration
Figure 4 shows the CD spectra of a DNA aptamer for CBN concentrations of zero to 17.1 mM.
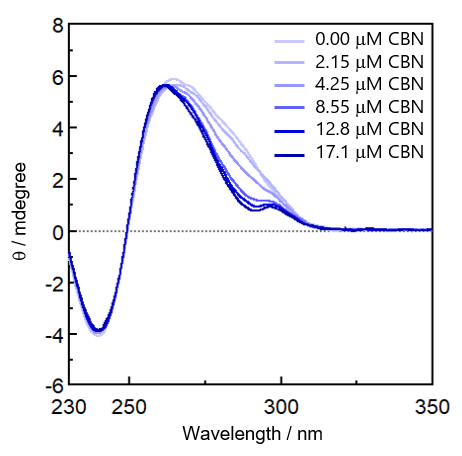
Fig. 4 CD spectra of DNA aptamer
A broad positive peak at around 250 to 300 nm and a negative peak at around 240 nm, which are associated with the Cotton effect, are observed. A small positive peak at around 295 nm, a large positive peak at around 260 nm and a negative peak at around 240 nm are observed at higher CBN concentrations. These peaks are generally observed for parallel or hybrid G-quadruplexes.a), 1-3) To estimate the DNA aptamer structure quantitatively, the HOS of the DNA aptamer was investigated using principal component analysis (PCA).a), 1-3) The CD spectrum of the G4 aptamer, whose absolute structure had been determined by X-ray crystallography and NMR analysis, was used as a reference to generate a PCA score plot, and then the CD spectrum of the DNA aptamer was analyzed (Figure 5).
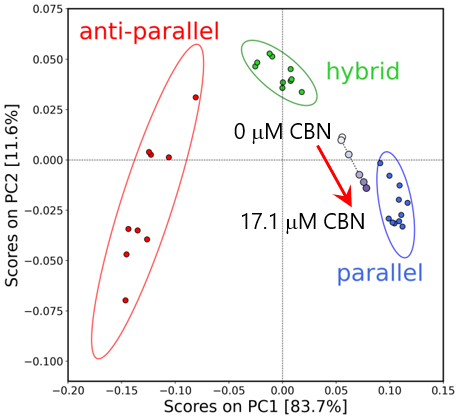
Fig. 5 PCA score plots for DNA aptamer
The ellipses indicate 95% confidence ranges. In the absence of CBN, the DNA aptamer structure is located midway between the parallel and hybrid types, and these structures are mixed, whereas at higher CBN concentrations the structure is closer to the parallel type, indicating that binding to CBN promotes the formation of the parallel structure.
Cross-reactivity of DNA aptamer with CBN analogs
The cross-reactivity of the DNA aptamer was evaluated by measuring its CD spectrum in the presence of different concentrations of CBN and CBN analogs. Figure 6 shows the relationship between the concentration of CBN and CBN analogs and the ellipticity (θ) at 291 nm.

Fig. 6 Cross-reactivity of DNA aptamer with CBN and CBN analogs
Here, the HTCD Plus was used to alternately measure the buffer solution and sample, and measurements were performed three times for each concentration, resulting in automatic measurement of 96 samples in a single run. From the CBN results, the ellipticity changed with concentration, indicating that the structure of the aptamer changed. On the other hand, no systematic change in ellipticity was observed for CBG and CBD at any concentration, suggesting that the structure of the aptamer was unchanged. This reveals that the DNA aptamer used in this experiment binds specifically to CBN but not to CBG or CBD, consistent with the report by Yu et al.1)
Conclusion
CD spectra of a DNA aptamer with different CBN concentrations were obtained, and the results of subsequent analysis showed that the structure of the aptamer was a mixture of parallel and hybrid G-quadruplexes in the absence of CBN, and that binding to CBN promoted the formation of the parallel type. The aptamer was found to specifically bind to CBN, but not to CBG or CBD. Thus, the HTCD Plus high-throughput circular dichroism measurement system, which allows up to 192 samples to be measured automatically, can be used to efficiently evaluate the structure and cross-reactivity of DNA aptamers with high measurement reproducibility.
References
a)200-CD-0037 Structure Evaluation of G-quadruplex Aptamers Using High-Throughput CD Measurement System and Principal Component Analysis
1)H. Yu, Y. Luo, O. Alkhamis, JC. Canoura, B. Yu, Y. Xiao: Anal. Chem., 93, 3172−3180 (2021). DOI: 10.1021/acs.analchem.0c04592
2)R. del Villar Guerra, J. O. Trent, J. B. Chaires: Angrew. Chem. Int. Ed. Engl., 57, 7171-7175 (2018). DOI: 10.1002/anie.201709184
3)V. Kuryavyi, A. T. Phan, D. J. Patel: Nucleic Acids Res., 38, 6757-6773 (2010). DOI:10.1093/nar/gkq558
This work was performed under the guidance of Professor Takehiko Wada of the Institute of Multidisciplinary Research for Advanced Materials, Tohoku University.
 Analysis of CBN-Binding DNA Aptamer using CD Spectroscopy")


