Introduction
The time course measurement is a useful method to monitor the transformation of molecular structure under thermal and electric filed perturbation, and there are several application examples such as analyses of orientational relaxation process of liquid crystal molecules1) and hardening process of glue.
One of recent demands for applications in the time course mapping measurement is to monitor the time course change of sample in micro area. In order to meet such demand by using of the time course mapping measurement, the multiple points mapping measurement program and also the [3D mapping data analysis] program are now available from JASCO. [Multiple mapping measurement] program allows repeated measurements (Time-resolved measurements) with pre-determined holding time between measurements and also multiple mapping measurements in different measurement areas. The [3D mapping data analysis] program can process 3 dimensional data consisting of in-plane distribution along with XY-axis and time course information along with Z-axis and in addition this software package has various functions to visualize measurement results in several different ways. (Figure 1)
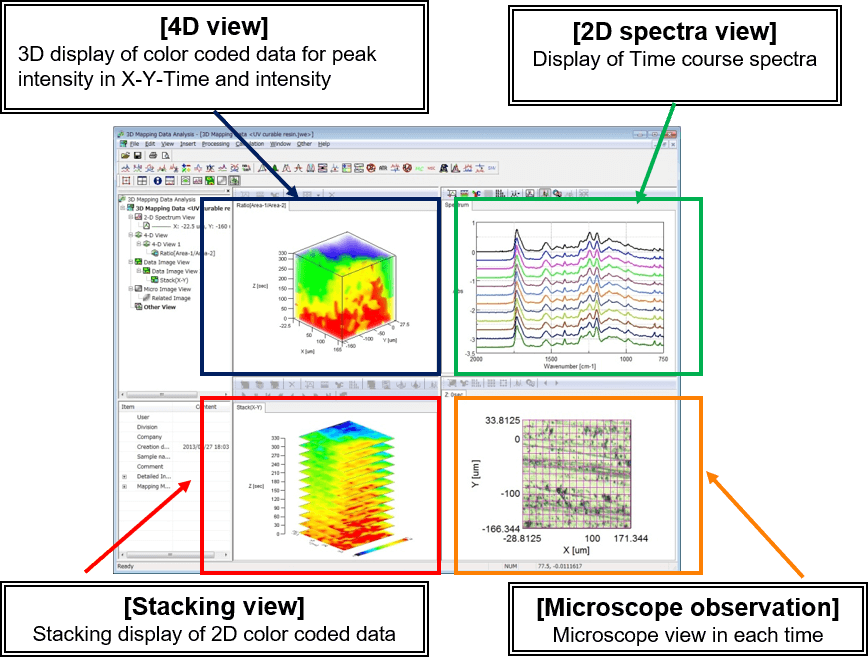
Figure 1. [3D mapping data analysis] Program
This time, utilizing JASCO’s highest speed multiple channel IR microscope system (capable of measurements with 160 points/sec as maximum), the time course mapping measurement was executed to monitor the hardening process of UV curing resins.
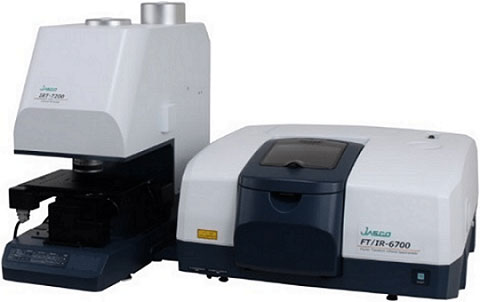
FTIR microscope system
Experimental
At the same time as the start of measurement, UV light was irradiated to curing resins on metal plate for execution of the time course mapping measurement.
Measurement conditions
Detector: Linear Array MCT detector
Objective lens: 16x Cassegrain mirror (12.5 x 12.5 µm/pixel)
Area: 200 x 200 µm (16 x 16 points)
Measurement method: Reflection measurement
Accumulation: 8 times
Resolution: 4 cm-1
Measurement time: 330 seconds
Measurement interval: 30 seconds
* In case of above measurement condition, it is possible to measure 200 x 200 µm approx. in 2 seconds. Therefore, for the sample with slow reaction in minutes order, it can be considered that measurement of such whole area as 200 x 200 µm was implemented simultaneously.
* Millisecond order time course mapping measurement can be done by using of the step scan type dynamic imaging instead of multiple points mapping measurement program.
Results
Obtained data is shown as 2D spectra in Figure 2. It is confirmed that peak intensity of (C) = C-H around 810 cm-1 was reduced gradually over time. It is assumed that double bond was being transformed to single bond due to hardening process of UV curing resins. On the other hand, it is clearly observed that peak intensity of C=O around 1730 cm-1 did not change in this hardening process.
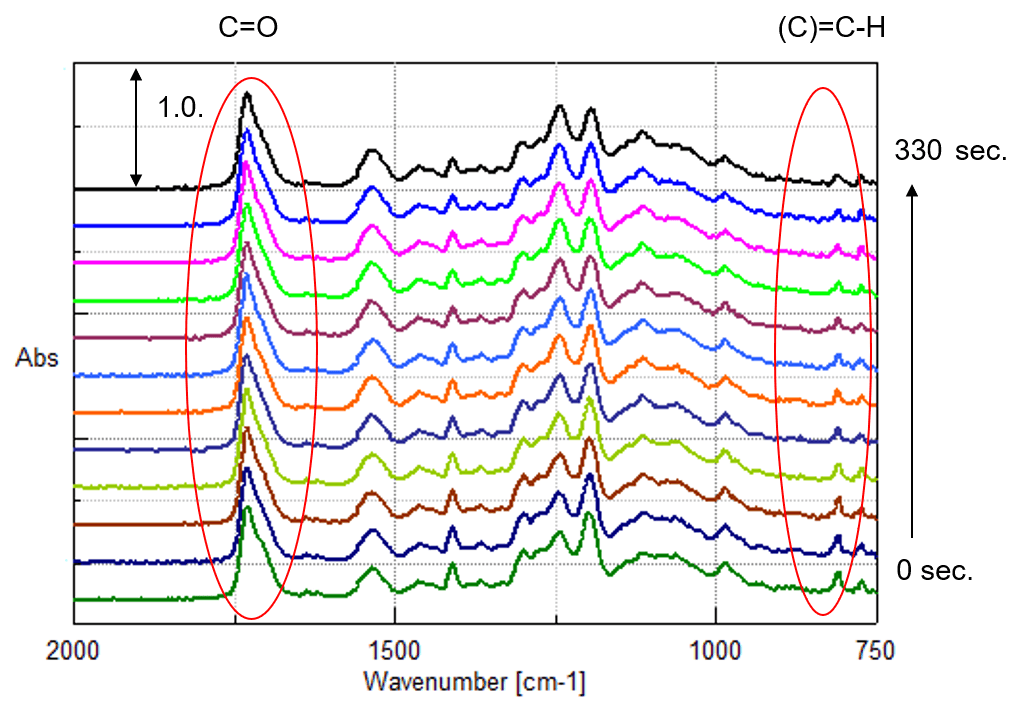
Figure 2. 2D Spectra View (Offset View)
Then, 4D view and stacking view (Figure 3) were created based on the peak height ratio of 810cm-1 and 1730 cm-1 with 1730 cm-1 as internal standard.
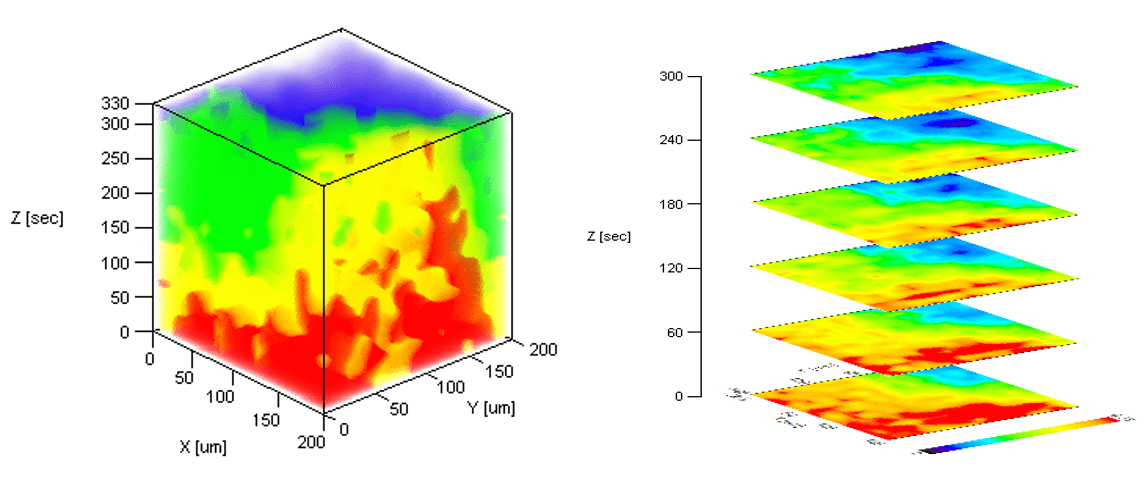
Figure 3. 4D view (left) and stacking view (right)
In 4D view and also stacking view, Z-axis exhibits time axis and the change of color at each part means the difference in reaction process depending on location of each part. And it also provides information on locality of UV irradiation or degree of hardening per unit area.
Furthermore, combination of various functions of 3D mapping analysis program such as 3D view (Figure 4) or color coded diagram makes it possible to analyze time course mapping data depending on specific purposes.
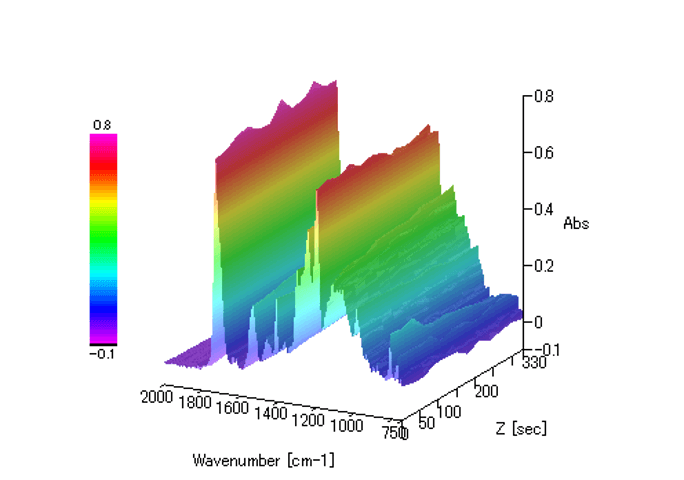
Figure 4. 3D Spectra View
References
1) Sugiyama, H.; Koshoubu, J.; Kashiwabara, S.; Nagoshi, T.; Larsen R. A.; Akao, K. Appl. Spectrosc. 2008, 62(1), 17-23.


