Introduction
Mid-IR, Near-IR, and Raman spectroscopy are widely used for qualitative and quantitative analysis of polymer, food, medicine, semiconductor material, etc., while if those methods are properly combined, it is possible to obtain more information on basic physical property of the sample. As an example, if Mid-IR and Near-IR spectroscopy are combined, the following information can be obtained.
- Dissociation energy of molecule (De)
- Absorption index in the IR and NIR region (α)
- Optical constant (n, k)
These values can provide the important perception for prediction of the chemical reaction or design of various devices. Additionally if IR and Raman spectroscopy are combined, the following information can be obtained.
- Complementary information on molecular vibration
- Information on lattice vibration by measurement in low wavenumber range (specific to Raman spectroscopy)
- Information on molecular vibration when combined with heavy atom
This article shows the perception of the basic physical property of the chloroform by measuring the Mid-IR/Near-IR/Raman spectrum.
Experimental
The Mid-IR and Near-IR spectrum are measured under the conditions as shown in Table 1. FTIR instrument can measure the Near-IR/Mid-IR/Far-IR spectrum by selecting the proper light source, detector, and beam splitter (B/S). The measurement range covered by general B/S used in FTIR is from 7800 to 375 cm-1, dedicated to IR range, while the newly developed broadband KBr B/S covers the range from 12000 to 375 cm-1, enabling the measurement of Mid-IR/Near-IR spectrum without replacing the B/S.
Table 1. Measuring conditions
| Measurement range (cm-1) | Light pathlength of liquid cell | Light source | Detector | B/S |
| 4000 to 400 | 0.025 mm | Ceramic | DLATGS | Broadband KBr |
| 6400 to 4000 | 1 mm | Halogen | ||
| 12000 to 6400 | 5 mm |
Results
Calculation of Dissociation energy (De) and Absorption index (α) of C-H by using Mid-IR and Near-IR spectrum
According to the general interpretation of the IR spectrum, the harmonic oscillator model is employed in which the atoms constituting the molecule are combined by spring (Dotted line by simple quadratic function in Figure 2), however, it is impossible to explain the overtone and combination tone in NIR region by this harmonic oscillator model.
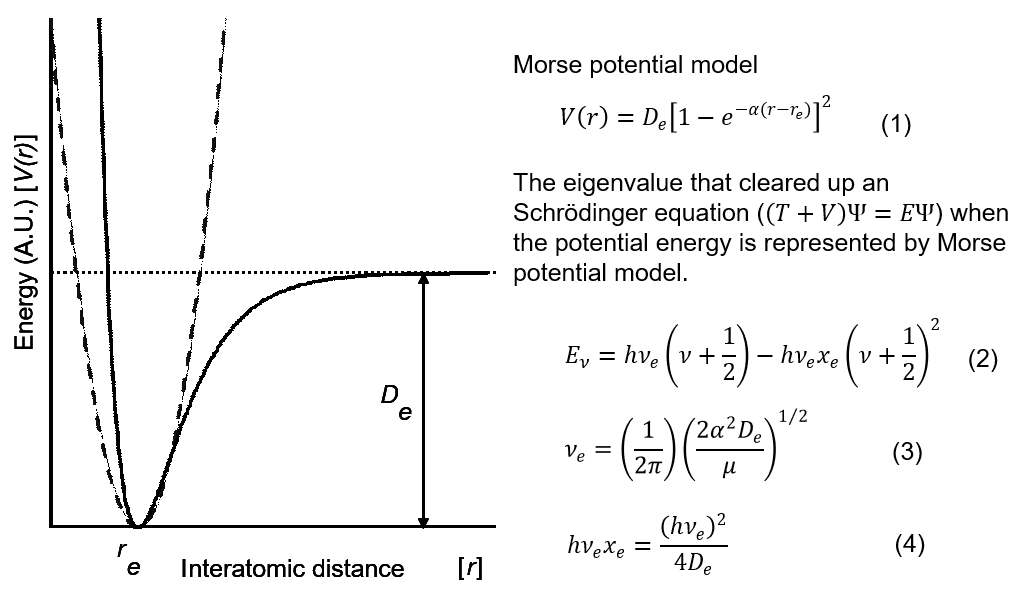
Figure 2. Morse potential model and non-harmonic oscillator potential model
Therefore, in order to interpret the NIR spectrum, the Morse function in which the anharmonic oscillation is taken into consideration (Continuous line in Figure 2)1). In the Morse function, the energy value is becoming close to Dissociation energy (De) asymptotically when interatomic distance increases. In this case, the De value of C-H is calculated by using absorption wavenumber of stretching vibration (ν1, 2ν1, 3ν1) of chloroform and Morse function. The Absorption index (α)** is also calculated by absorbance (Abs) at each wavenumber of. The IR/NIR spectrum of chloroform and attribution of each peak are shown in Figure 3.
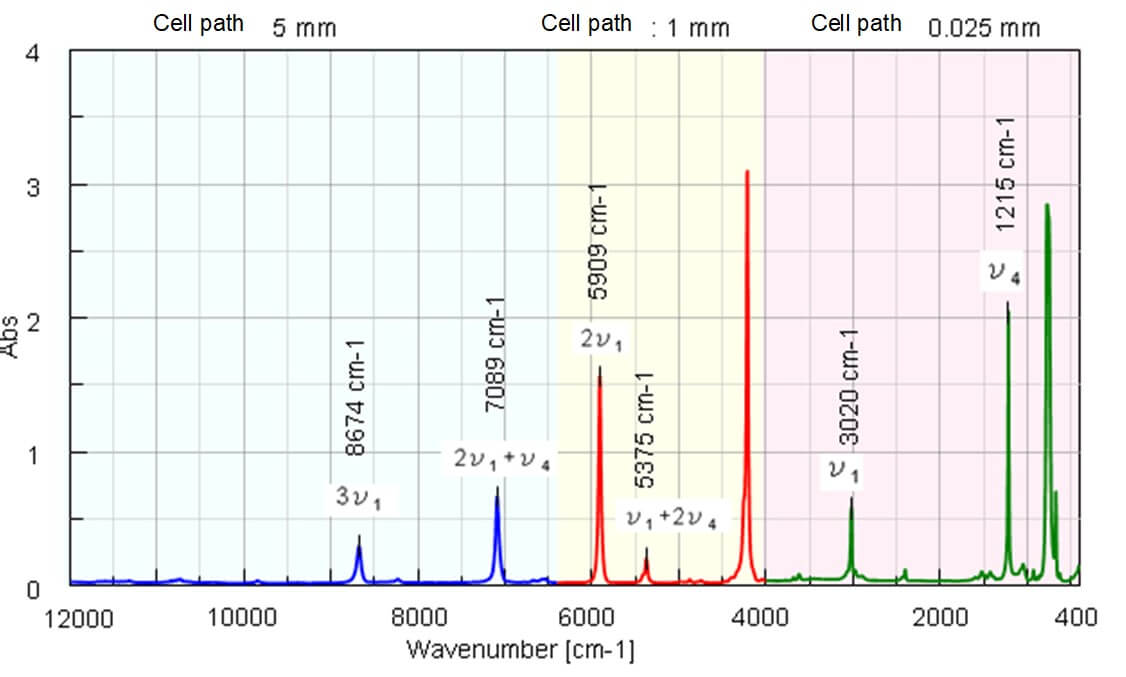
Figure 3 Mid-IR/Near-IR spectrum of Chloroform
The dissociation energy (De) of C-H in chloroform is calculated to be 460 +/- 7 kJ/mol from equation 2, equation 4, and value of absorption wavenumber of stretching vibration of C-H (ν1, 2ν1, 3ν1)2).
The absorption index a of ν1, 2ν1, 3ν1 is calculated from measured spectra to be 219, 15.5, and 0.56 respectively as shown in Table 2.
Table 2. Absorbance index and assignment of Chloroform
| Wavenumber [cm-1] | Assignment | Abs | α**) |
| 3020 | ν1 (C-H stretching vibration) | 0.55 | 219 |
| 1215 | ν4 (C-H bending vibration) | 2.02 | 806 |
| 5375 | ν1+2ν4 | 0.19 | 1.88 |
| 5909 | 2ν1 | 1.55 | 1.55 |
| 7089 | 2ν1+ν4 | 0.65 | 1.30 |
| 8674 | 3ν1 | 0.28 | 0.56 |
**) α: Absorbance if the light path is 1 cm for this experiment
From those results, for general organic substances, it is estimated that the sample with high concentration can be quantitated, such as about several 10 times if 2ν1 is used and about several 100 times if 3ν1 is used. Therefore, in NIR range, it is possible to measure the samples in non-destructive method, without dilution which is required for IR measurement.
IR and Raman spectra of chloroform
Figure 4 shows the IR spectrum (Vertical axis: %T) and Raman spectrum (Vertical axis: Int.).
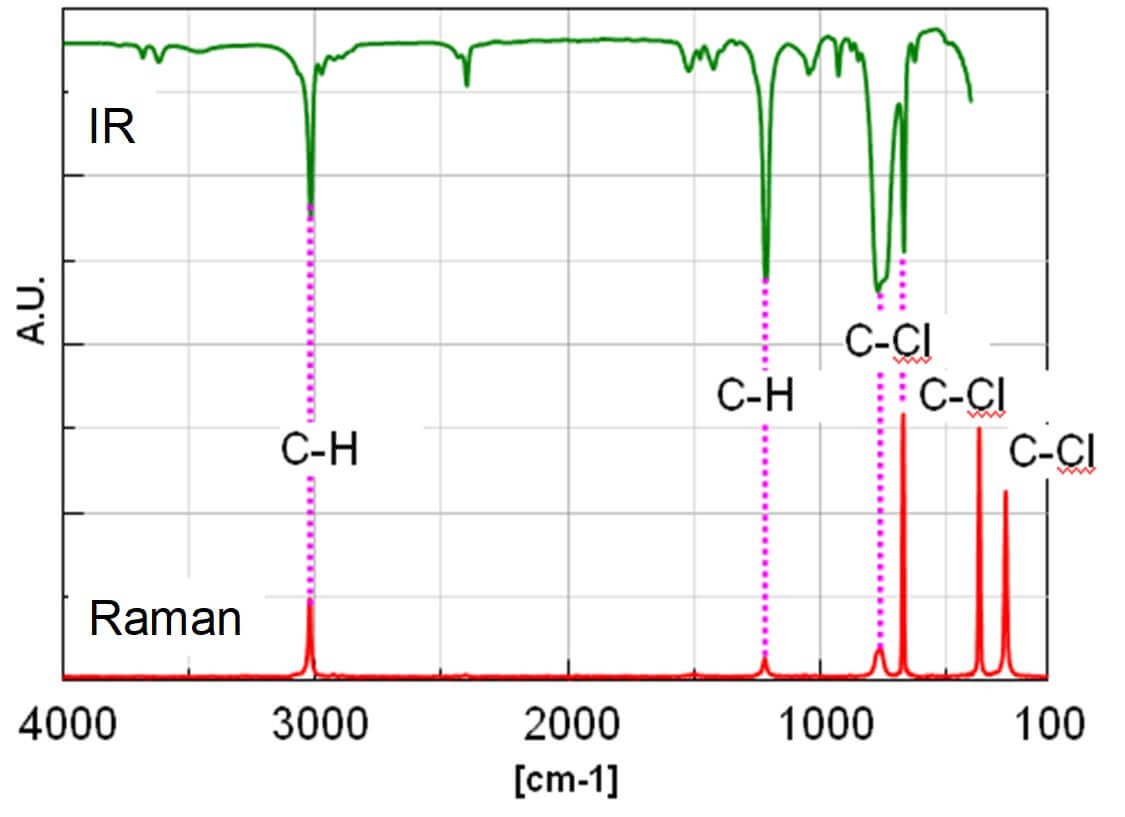
Figure 4 IR and Raman spectrum of Chloroform (Vertical scale: A.U. due to showing %T and Int., Horizontal scale: [cm-1] for wavenumber and Raman shift.)
The peak intensity ratio in IR spectrum between ν1 and ν4 of C-H is about 3.68 from Table 2. Regarding this, since the intensity ratio in Raman spectrum is about 1/4, it is confirmed that the peak intensities of IR and Raman spectrum are complementary. In general, when the change of the dipole moment in the molecular vibration is larger (asymmetric vibration mode), the intensity of peak in IR spectrum appears higher, while the stronger peak in Raman spectrum is detected when the change of the polarizability is larger (symmetric vibration mode). Therefore, the change of the dipole moment for ν1 of C-H is considered to be larger than the one of ν4 (the change of polarizability is smaller). The vibration of molecule combined with the heavy atom like C-Cl can be considered to be detected in the range less than 400 cm-1 from Raman spectrum. It is important to select IR or Raman depending on the vibration mode even if the structure of molecule is simple like Chloroform.
Conclusion
This article shows one of the topics in vibrational spectroscopy taking the chloroform for example, using broadband KBr B/S. Besides, it can be considered that as well as the general qualitative and quantitative analysis, the broadband KBr B/S can be applied to the 2D correlated spectroscopy based on chemical reaction analysis by time-course measurement using 3 measurement methods. By using broadband KBr B/S which does not require replacement, the measurement mode can be switched without breaking vacuum or interrupting Nitrogen purge. This broadband B/S will expand the potential to wider application fields.
References
1) Kenneth W.busch, et,al, Appl.Spectrosc.54,1321(2000)
2) Chemical Handbook, the revised third edition


