Introduction
DNA aptamers are short DNA molecules that bind to a specific molecule. Since they can be produced by chemical synthesis and have high specificity to their target molecules, they have been attracting attention as the next-generation ligands for pharmaceutical and biosensing applications. Metal ions are required for the thermodynamic stability of DNA structure, and the changes in the type and concentration of metal ions cause changes in DNA structure. It is therefore important to evaluate how these metal ions effect the structure of DNA aptamers.
Circular dichroism (CD) is an effective technique for estimating the tertiary structure of nucleic acids at low concentrations under homogeneous conditions. This application note reports the tertiary structure evaluation of G-quadruplex (G4) aptamers using a high-throughput CD (HTCD) measurement system and the principal component analysis (PCA).
G4 tertiary structure Four guanine bases can associate to form a square planer structure called G-quartet, and two or more G-quartets can stack on each other to form a G4 structure. G4 is known to have three types of tertiary structure: parallel, hybrid, and anti-parallel (Figure 1). It is also known that the structure of a G4 changes between these three structures and the mixture of them depending on the type or concentration of metal ions.
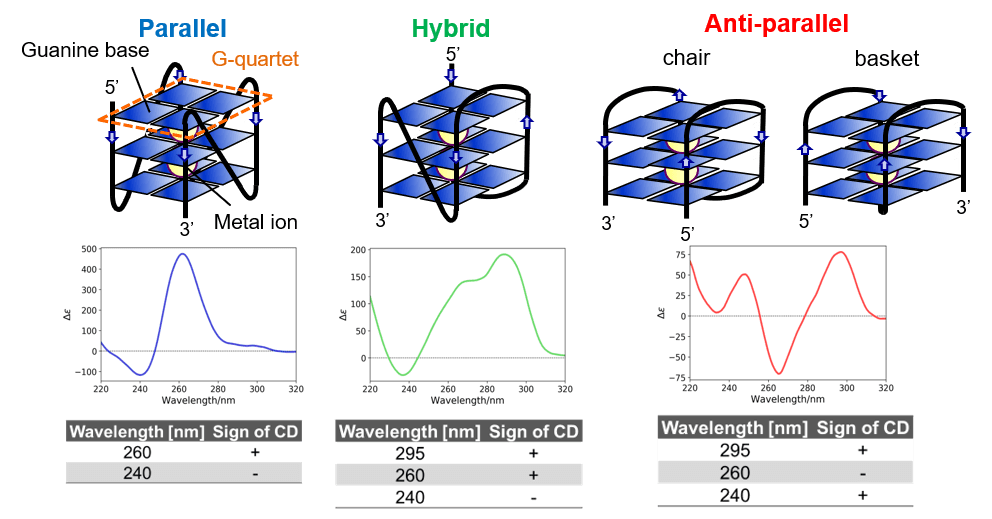
Figure 1. Types of G4 tertiary structures and their CD spectra.
Experimental
CD measurement
Measurement system Eight G4 aptamers with different sequences were prepared in five different buffers. Each sample was measured in triplicate and each buffer was measured once. In total, 125 specimens were measured using the HTCD measurement system.
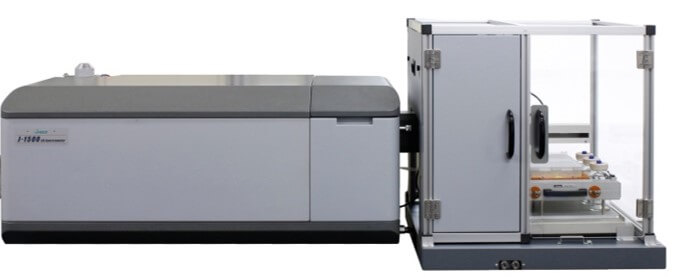
HTCD measurement system.
J-1500 is combined with HTCD Plus.
<Features of HTCD measurement system>
• Fully automated from sample delivery to cleaning and drying of the flow
• Up to 192 specimens measured in a single run
• All-night measurements possible
Sample
In this application note, the results of one of the eight aptamers measured are shown. T-SO606 1) (5’-GGGTCGGCTGTCCGTGGGTGGGGA-3’) was prepared in 10 mM Tris-HCl at pH 7.4 with following different salt concentrations.
TBS – NaCl: 150 mM KCl: 0 mM
TBSK – NaCl: 150 mM KCl: 5 mM
TK – NaCl: 0 mM KCl: 5 mM
TK150 – NaCl: 0 mM KCl: 150 mM
Tris – NaCl: 0 mM KCl: 0 mM
The final concentration of T-SO606 was adjusted to 20 μM.
Measurement parameters
The measurement parameters used to obtain the CD spectra of T-SO606 are as below.
Wavelength: 320-220 nm
Data pitch: 0.1 nm
Bandwidth: 1 nm
Accumulations: 4
D.I.T.*: 4 sec.
Path length: 1 nm
Scan speed: 50 nm/min.
Sample volume: 100 μL
*D.I.T.: Data Integration Time
Analysis
Tertiary structure of T-SO606 was estimated from the CD spectra using the PCA method. 24 reference CD spectra of G4 structures (Figure 3A) were used to create a PCA score plot shown in Figure 3B. The 23 spectra2) of the reference spectra were kindly provided by Dr. Rafael del Villar-Guerra and Prof. Jonathan B. Chaires and the other one was 2KYP3). The score plot was created using 5 principle components and processed by normalizing and centering the data.
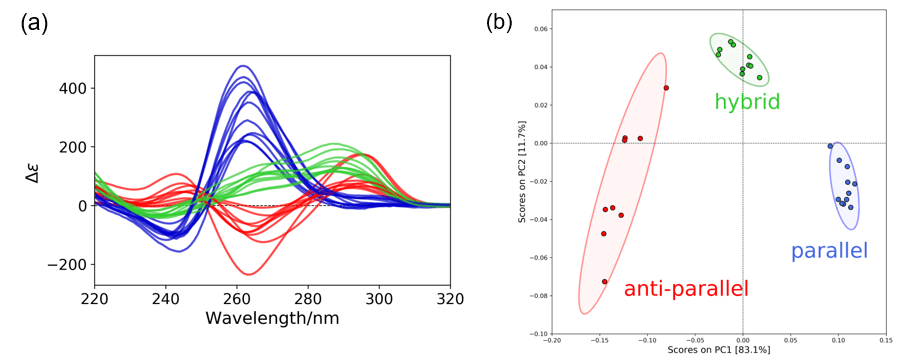
Figure 3. Creation of a PCA score plot. (a) Reference spectra. Blue, green, and red colored spectra indicate parallel, hybrid, and anti-parallel respectively. (b) PCA score plot. The ellipses indicate the 95% confidence limits of each structure.
Keywords
Nucleic acid medicine, biosensor, DNA aptamer, G-quadruplex, G4 aptamers, circular dichroism, high-throughput CD measurement system, HTCD, principal component analysis, PCA
Results
The CD spectra of T-SO606 under five different buffer conditions are shown in Figure 4 and indicate that the spectral shape change depending on the buffer condition. T-SO606 in buffer containing a high NaCl concentration but no KCl (TBS) has positive peaks at around 295 nm and 240 nm and a negative peak at around 260 nm, reminiscent of G4 antiparallel structure (Figure 1). T-SO606 in buffers containing KCl (TBSK, TK, and TK150) have a positive peak at around 260 nm and a negative peak at around 240 nm, similar to G4 parallel structure (Figure 1). T-SO606 in a buffer with no NaCl nor KCl (Tris) has positive peaks at around 285 nm and 255 nm and a negative peak at around 235 nm. This spectrum is comparable to the hybrid structure of G4, however, they have different spectral shapes.
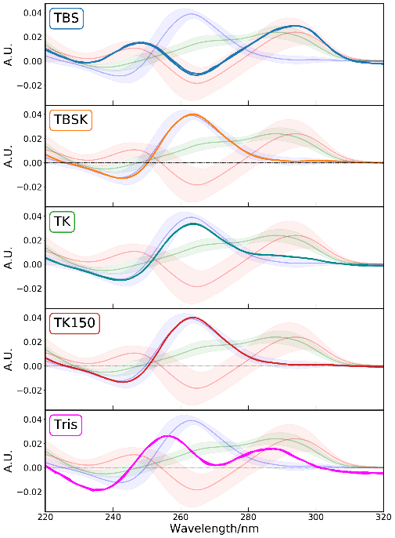
Figure 4. CD spectra of T-SO606 under five buffer conditions. The spectrum which is drawn with a lighter color in the background and the colored area around the spectrum indicate the average spectrum of each structure and its 2σ limit. Blue, green and red color indicate parallel, hybrid and anti-parallel respectively.
The PCA scores of T-SO606 in five different buffer conditions are plotted in the PCA score plot in Figure 5. The PCA scores indicate that TBS, a buffer containing high concentration of NaCl only, tends to induce an anti-parallel structure of T-SO606, whereas TBSK and TK150, buffers containing KCl, tend to induce a parallel structure. These considerations agree with the CD data in Figure 4. However, TK, a buffer seemed to induce a parallel structure considering the spectral shape, has a score that is out of the 95 % confidence limit of the parallel structure. The plot is located between the 95 % confidence limits of the parallel and anti-parallel but still close to the parallel one, which indicates that TK may induce the equilibrium in which T-SO606 has a structure similar to a parallel structure but partially contains an anti-parallel structure. The peak feature of T-SO606 in Tris was similar to the one of a hybrid structure, however, its score is plotted between the 95 % confidence limits of the parallel and anti-parallel. It is assumed that Tris tends to induce the equilibrium between a parallel structure and an anti-parallel structure.
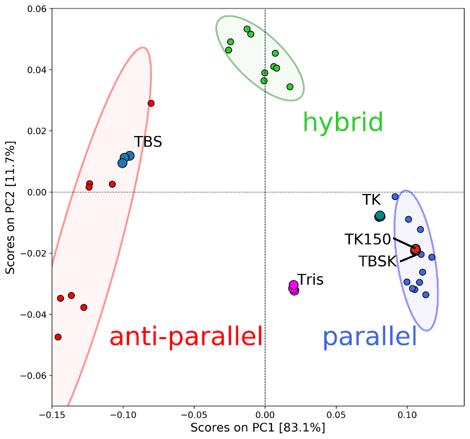
Figure 5. PCA scored of T-SO606 in five different buffers.
Conclusion
CD spectra of 125 specimen were effectively measured using the JASCO HTCD system, and the structure of G4 aptamers were quantitatively analyzed using the PCA method. This application note demonstrates that HTCD system can achieve automated measurements of a large number of specimen and therefore is effective for comprehensive investigation of structural feature of G4 aptamers as well as other biomolecules.
References
1. K. Tsukakoshi, K. Abe, K. Sode, K. Ikebukuro, Anal Chem., 2012, 84, 5542-5547.
2. R. del Villar Guerra, J. O. Trent, J. B. Chaires, Angrew. Chem. Int. Ed. Engl., 2018, 57, 7171-7175.
3. V. Kuryavyi, A. T. Phan, D. J. Patel, Nucleic Acids Res., 2010, 38(19), 6757-6773.
This application was developed under the guidance of Dr. Kaori Tsukakoshi and Prof. Kazunori Ikebukuro of Tokyo University of Agriculture and Technology.


 properties of platinum complexes using a CPL measurement system and a spectrofluorometer")


