
Introduction
< Key Points >
– Imaging data can be analyzed even without detailed knowledge about key bands.
– Quick and easy data analysis
A common method for analyzing FT-IR imaging data is to focus on key bands in the spectrum and create a color-coded chemical map using the calculated peak area or peak height. However, experience and specialized knowledge are required to properly select key bands. Therefore, multivariate curve resolution (MCR) analysis, which does not require key-band selection, is also used to analyze data. However, for effective MCR analysis, appropriate spectral preprocessing is first required.
To allow easy and efficient preprocessing, the JASCO [Analysis Assist] function has been developed. This allows imaging data to be easily analyzed by performing spectral preprocessing using a wizard-style interface in the form of a flowchart. This report compares color-coded chemical maps created by key-band selection with those created using the [Analysis Assist] function for data acquired by FT-IR microscopy. Results are also compared for rapid screening analysis using these two methods.
[Analysis Assist] function
The [Analysis Assist] function uses a wizard-style interface in the form of a flowchart to allow the user to easily create appropriate color-coded chemical maps using MCR analysis. The flowchart shows the preprocessing steps required for MCR, and provides guidance for each operation. This allows the same results to be obtained regardless of the analyst.
In addition, the ability to create and save recipes allows single-click analysis of different imaging data under the same conditions.
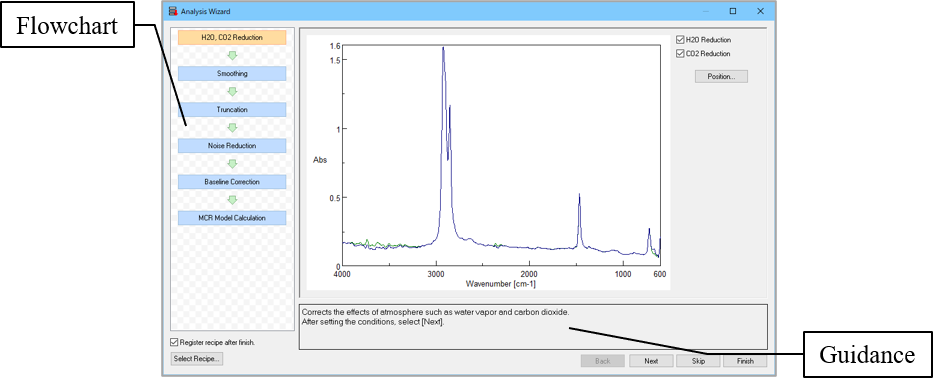
Fig. 1 Example of [Analysis Assist] function
Experimental
Sample
Particles (polyethylene, polystyrene, polypropylene, proteins) scattered on KBr plate
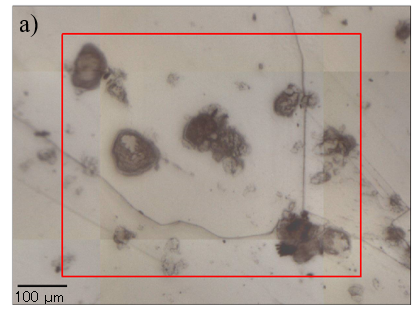
Fig. 2 Sample observation image
System
Instrument: FT/IR-6X FT-IR spectrometer
Accessory: IRT-7X Multichannel IR microscope
Parameter set 1 (normal method, prioritize S/N)
Resolution: 4 cm-1
Accumulations: 16
Method: Transmission microscopy
Objective: 16x Cassegrain mirror
Detector: Linear-array midband MCT
Pixel resolution: 12.5 µm x 12.5 µm
Area: 587.5 µm x 475 µm
Number of points: 48 x 39 (1872)
Time: Approximately 4 min
Parameter set 2 (screening)
Resolution: 16 cm-1
Accumulations: 1
Method: Transmission microscopy
Objective: 16x Cassegrain mirror
Detector: Linear-array midband MCT
Pixel resolution: 12.5 µm x 12.5 µm
Area: 587.5 µm x 475 µm
Number of points: 48 x 39 (1872)
Time: Approximately 10 sec
Keywords
Analysis assist, imaging, multivariate curve resolution, MCR, FT-IR microscopy, multivariate analysis, screening
Results
Results 1 (prioritize S/N ratio)
Imaging measurements were first performed using parameter set 1, and a color-coded chemical map was created based on the peak heights of the key bands for each component. Figure 3a shows the chemical map, and Fig. 3b shows the IR spectrum and key-band position (arrows) for each component.
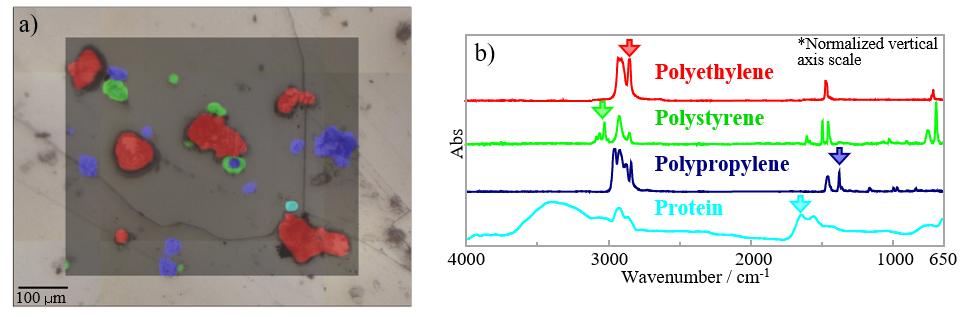
Fig. 3 Analysis based on key bands a) color-coded map b) IR spectrum and key band for each component
The key bands selected corresponded to C-H symmetric stretching vibrations of polyethylene, C-H stretching vibrations of the benzene ring in polystyrene, C-H angular vibrations of polypropylene, and amide I of protein. Figure 3a reveals that each particle observed in Fig. 2 can be assigned to a particular component.
For comparison, Fig. 4a shows the corresponding results obtained using the [Analysis Assist] function, and Fig. 4b shows the spectrum of each principal component obtained from the MCR analysis.
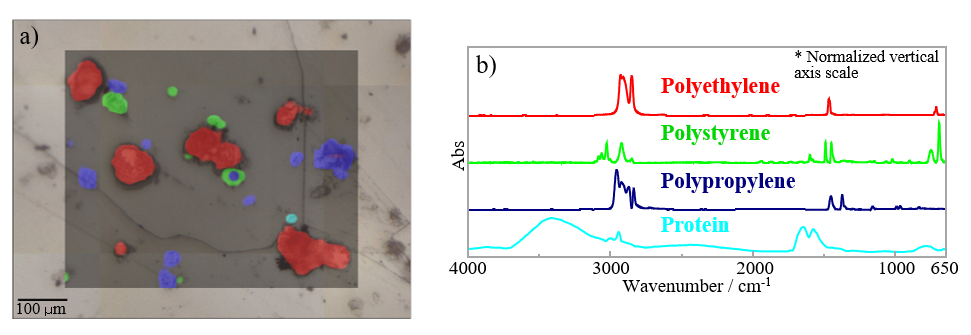
Fig. 4 Analysis based on MCR a) color-coded map b) principal component spectrum for each component
It can be seen that the chemical maps in Figs. 3a and 4a are almost identical. Also, the spectral shapes in Figs. 3b and 4b are very similar around the selected key bands. It can therefore be concluded that MCR analysis can produce accurate chemical maps even when key bands are not chosen.
Result 2 (screening)
Imaging measurements were next performed using parameter set 2 for rapid screening. Figure 5 shows the MCR analysis results obtained using the [Analysis Assist] function, which indicate that it is possible to estimate the distribution of components in a sample even from screening data obtained using a short measurement time.
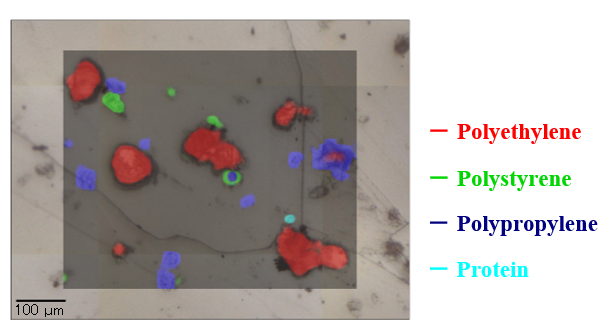
Fig. 5 MCR analysis results (parameter set 1, screening)
The chemical map in Fig. 5 is almost the same as those in Figs. 3a and 4a, even though the measurement time was reduced by a factor of 20. This indicates the effectiveness of MCR analysis with the [Analysis Assist] function for such screening measurements. A comprehensive analysis can be carried out by first performing short-time measurements in a small target area, followed by longer measurements to optimize the S/N ratio.
Conclusion
The JASCO [Analysis Assist] function eliminates the need for specialized knowledge and experience, and provides analysis results equivalent to those obtained by focusing on key bands, which is the standard analysis method for imaging data. In addition, even for screening measurements with a reduced measurement time, the results are sufficient to visualize the distribution of components in a sample. The [Analysis Assist] function can be used not only for FT-IR microscopy but also for Raman microscopy, allowing its application to fields such as chemistry, environmental science, food, pharmaceuticals, and semiconductors.
Related Posts:
 Streamlining Data Processing to Evaluate…
 Higher-Order Structure (HOS) Analysis of CBN-Binding…
 Analysis of Styrofoam by GPC/SEC using mixed gel column
 Analysis of Amino Acids by On-line Pre-column…
 Analysis of Carbon Products using Raman Spectroscopy
 Analysis of Electronic Structure and Orbital Angular…