Introduction
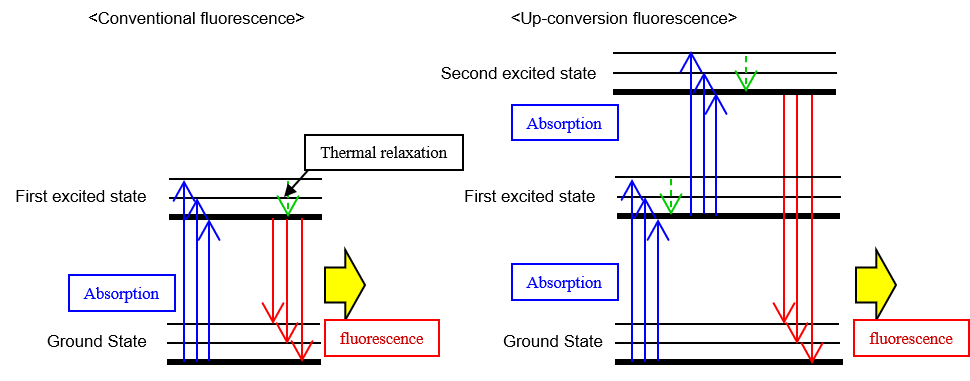
The up-conversion is the process of multi-step excitation to produce the fluorescence light whose wavelength is shorter than the one of excitation light (Refer to Fig.1). This is expected to be used for following applications; (1) labeling for bio-imaging, (2) anti-counterfeit ink, (3) development of solar cell for infrared light.
The up-conversion fluorescence intensity is proportional to the n-th power of the excitation intensity, where n is the number of photons for excitation. Therefore, the researchers who develop the up-conversion phosphors are interested in the up-conversion fluorescence intensity measurement for analyzing the excitation process of the material, and are also interested in the up-conversion quantum yield measurement. Generally, the quantum yield of up-conversion material is very low, and the measurement system with high-sensitivity is required.
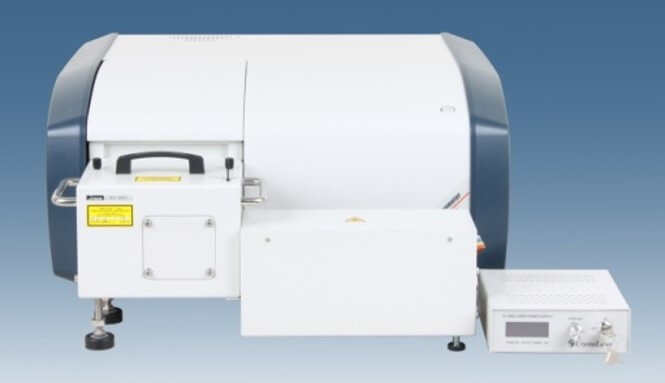 JASCO have developed the up-conversion quantum yield measurement system, which can detect the very small fluorescence by using laser.
As a example of measurement, this report shows the quantum yield measurement of the up-conversion phosphors with heavy rare earth.
Experimental
Sample
1. YTa7O19: Er10, Yb40
2. YTa7O19: Ho4, Yb60
3. YTa7O19: Tm3, Yb80
4. RETa7O19: Er90, Tm10
5. GdTa7O19: Er10, Yb40
6. Gd2O3: Er5, Yb10
Measurement parameters
Emission bandwidth: 5 nm
Scan speed: 1000 nm/min
Response: 0.2 sec
Data acquisition interval: 0.2 nm
Laser wavelength: 980 nm
Laser output: 150 mW
Keywords
Up-conversion phosphors, quantum yield, heavy rare earth
Results
In order to evaluate the measurement reproducibility, each sample was measured for three times.
Fig.3 – 8 show the following spectra of each sample; (1) spectrum of excitation light, (2) spectrum of scattered light, (3) fluorescence spectrum. Table 1- 6 show the analysis result of quantum yield measurement.
As show in the tables except for table 3 (YTa7O19: Tm3, Yb80), this system could evaluate the quantum yield less than 1%.
1. YTa7O19: Er10, Yb40
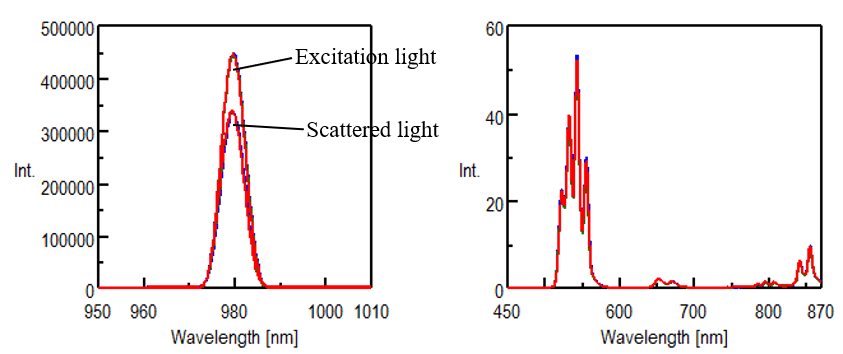
Fig.3 The scattered light spectra and the fluorescence spectra
(Blue: first, Green: second, Red: third)
Table.1 Result of internal quantum yield
| Area of Excitation light | Area of Scattered light | Area of Absorption | Area of Fluorescence | Sample absorbance [%] | Internal quantum yield [%] | |
|---|---|---|---|---|---|---|
| 1 | 2.80E+06 | 2.14E+06 | 663270 | 1453.86 | 23.69 | 0.22 |
| 2 | 2.73E+06 | 2.14E+06 | 587840 | 1378.84 | 21.57 | 0.23 |
| 3 | 2.83E+06 | 2.14E+06 | 687620 | 1433.8 | 24.28 | 0.21 |
2. YTa7O19: Ho4, Yb60
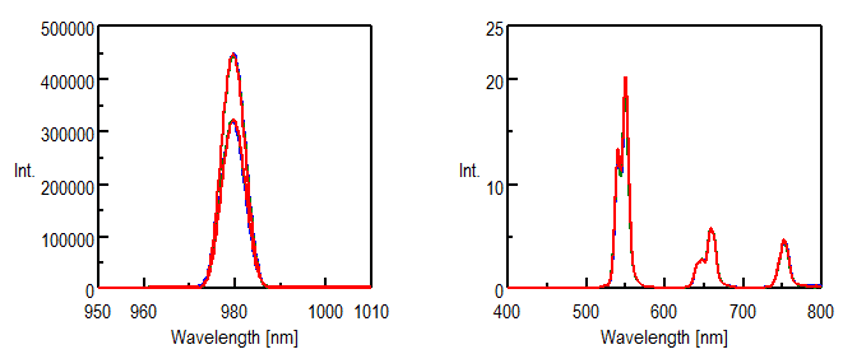
Fig.4 The scattered light spectra and the fluorescence spectra
(Blue: first, Green: second, Red: third)
Table.2 Result of internal quantum yield
| Area of Excitation light | Area of Scattered light | Area of Absorption | Area of Fluorescence | Sample absorbance [%] | Internal quantum yield [%] | |
|---|---|---|---|---|---|---|
| 1 | 2.75E+06 | 2.07E+06 | 685000 | 501.572 | 24.88 | 0.073 |
| 2 | 2.80E+06 | 2.09E+06 | 708860 | 498.81 | 25.32 | 0.070 |
| 3 | 2.87E+06 | 2.05E+06 | 821920 | 515.899 | 28.59 | 0.063 |
3. YTa7O19: Tm3, Yb80
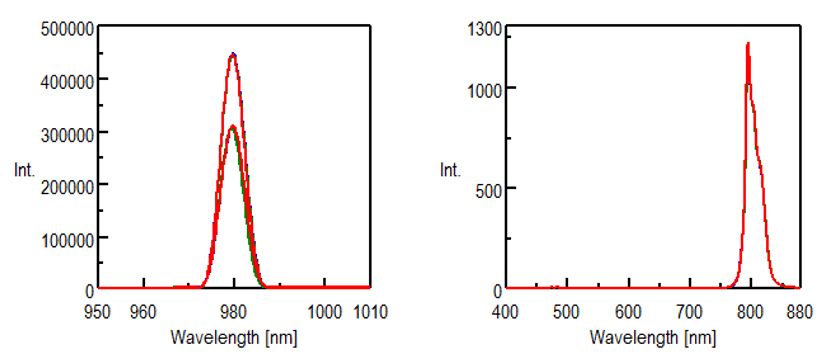
Fig.5 The scattered light spectra and the fluorescence spectra
(Blue: first, Green: second, Red: third)
Table.3 Result of internal quantum yield
| Area of Excitation light | Area of Scattered light | Area of Absorption | Area of Fluorescence | Sample absorbance [%] | Internal quantum yield [%] | |
|---|---|---|---|---|---|---|
| 1 | 2.75E+06 | 1.92E+06 | 833340 | 31500.1 | 30.32 | 3.78 |
| 2 | 2.75E+06 | 1.91E+06 | 845170 | 32176.7 | 30.73 | 3.81 |
| 3 | 2.77E+06 | 1.95E+06 | 819330 | 31277.2 | 29.55 | 3.82 |
4. RETa7O19: Er90, Tm10
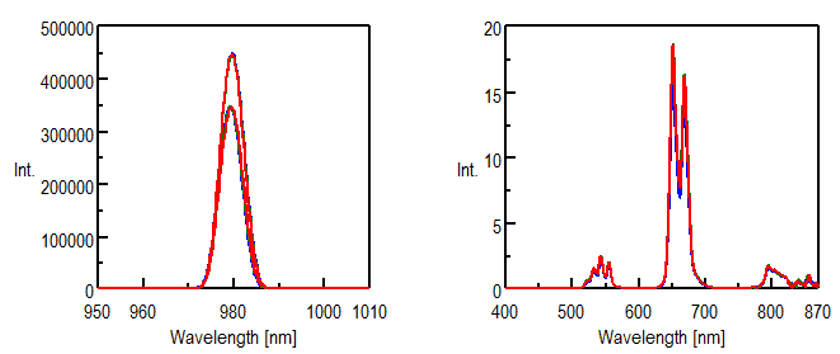
Fig.6 The scattered light spectra and the fluorescence spectra
(Blue: first, Green: second, Red: third)
Table.4 Result of internal quantum yield
| Area of Excitation light | Area of Scattered light | Area of Absorption | Area of Fluorescence | Sample absorbance [%] | Internal quantum yield [%] | |
|---|---|---|---|---|---|---|
| 1 | 2.74E+06 | 2.14E+06 | 594410 | 501.341 | 21.71 | 0.084 |
| 2 | 2.86E+06 | 2.16E+06 | 698340 | 446.071 | 24.44 | 0.064 |
| 3 | 2.76E+06 | 2.14E+06 | 620210 | 566.941 | 22.45 | 0.091 |
5. GdTa7O19: Er10, Yb40
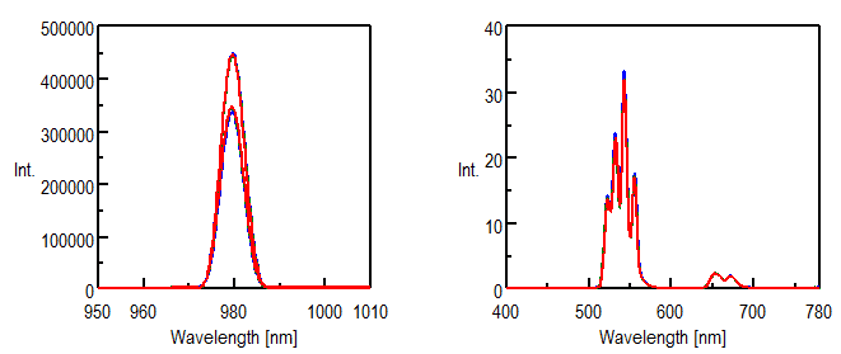
Fig.7 The scattered light spectra and the fluorescence spectra
(Blue: first, Green: second, Red: third)
Table.5 Result of internal quantum yield
| Area of Excitation light | Area of Scattered light | Area of Absorption | Area of Fluorescence | Sample absorbance [%] | Internal quantum yield [%] | |
|---|---|---|---|---|---|---|
| 1 | 2.74E+06 | 2.08E+06 | 663190 | 908.777 | 24.22 | 0.14 |
| 2 | 2.83E+06 | 2.16E+06 | 664660 | 863.496 | 23.51 | 0.13 |
| 3 | 2.85E+06 | 2.20E+06 | 654600 | 843.468 | 22.97 | 0.13 |
6. Gd2O3: Er5, Yb10
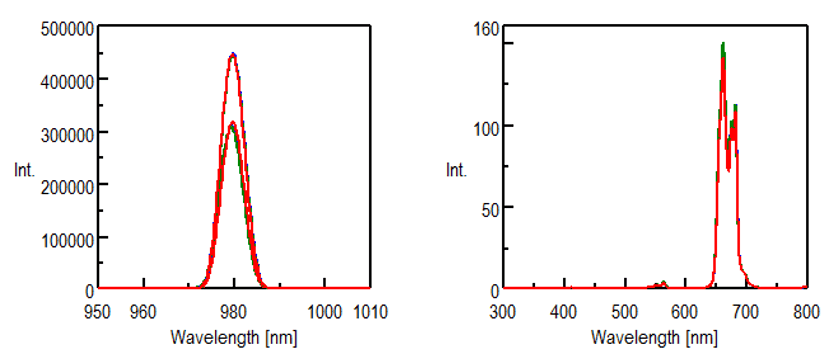
Fig.8 The scattered light spectra and the fluorescence spectra
(Blue: first, Green: second, Red: third)
Table.6 Result of internal quantum yield
| Area of Excitation light | Area of Scattered light | Area of Absorption | Area of Fluorescence | Sample absorbance [%] | Internal quantum yield [%] | |
|---|---|---|---|---|---|---|
| 1 | 2.78E+06 | 1.99E+06 | 789990 | 3932.3 | 28.39 | 0.50 |
| 2 | 2.82E+06 | 1.96E+06 | 860170 | 3969.62 | 30.49 | 0.46 |
| 3 | 2.82E+06 | 1.95E+06 | 863860 | 3760.07 | 30.68 | 0.44 |
References
Data courtesy of Dr. Kouji Tomita, Department of Chemistry, School of Science, Tokai University


