Introduction
Fourier transform infrared (FTIR) spectrometers are often used for gas analysis in place of dedicated gas detection systems due to their greater flexibility. Gas analyzers are typically used for simple measurement, but in the analysis of mixed gases the results can be erroneous due to the presence of various component gases. Often, a dedicated gas analyzer is selected according to the composition of the gas and it can be difficult to simultaneously analyze components in mixed gas samples. The use of FTIR spectroscopy allows the quantitation of several target gases based on their signature absorption peaks even in a mixture, and almost all gases of interest have an absorption in the mid-infrared spectral range. The simultaneous analyses of individual gases in a mixture can be made by using a calibration curve for each gas component based on their absorption peaks. The simultaneous monitoring of multicomponent gas samples can be made using an FT/IR-4000 of FT/IR-6000 series FTIR spectrometer with gas cell and the ‘Interval Measurement’ application program. A full vacuum FT/IR-6000 with a multi-pass gas cell comprises a gas analysis system capable of providing analyses of very low concentration gases with the elimination of the interference of atmospheric water vapor and carbon dioxide. This application note details the software programs and the various gas cells required for mixed gas analysis.
Software Program Overview for Simultaneous Quantitation of Multi-Component Samples
- Simultaneous quantitation of up to 20 components
- Time interval measurement
- Multicomponent spectral quantitative analysis
- Flexible calibration, selection, and exchange of calibration curves
- Concentration monitoring display
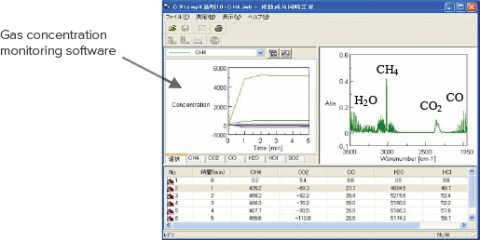
Figure 1. Example of multicomponent measurement using simultaneous quantitation
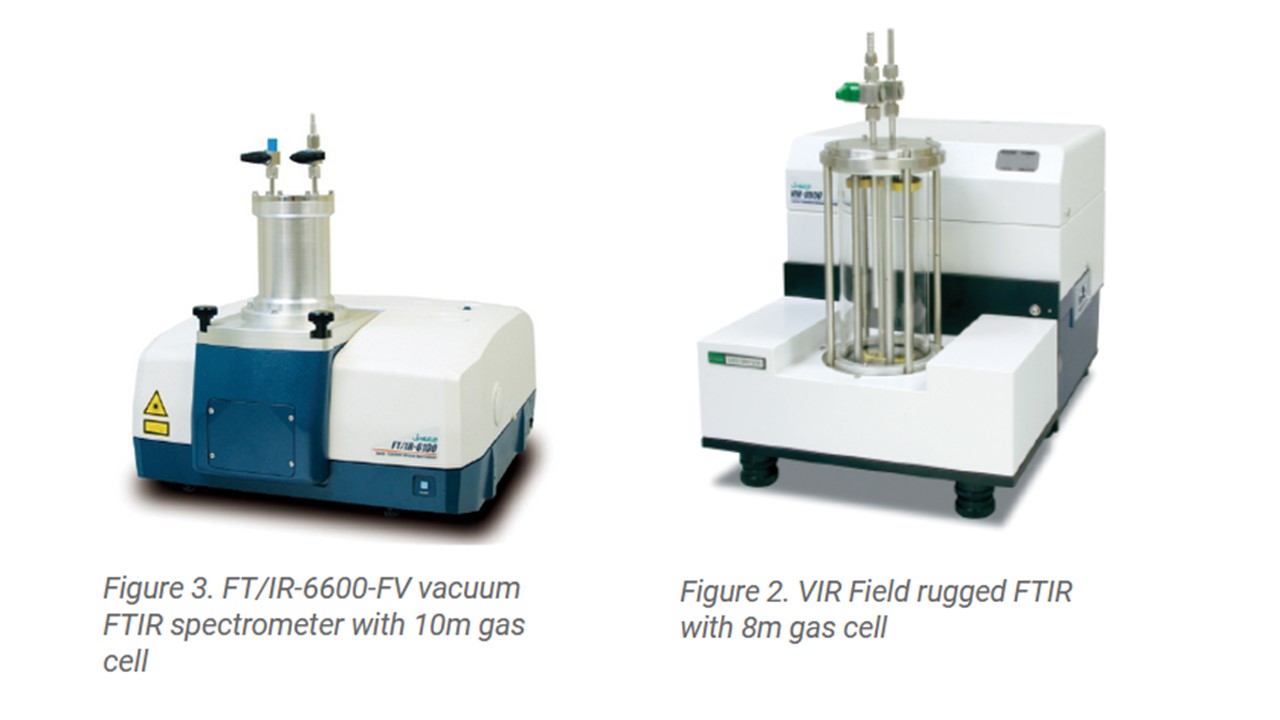
As shown in Figure 1, The time course monitor of each component gas is simultaneously displayed. Figures 2 and 3 illustrate two dedicated gas monitoring instrument systems.
Experimental
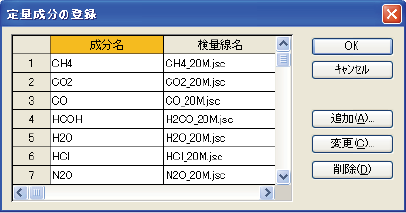
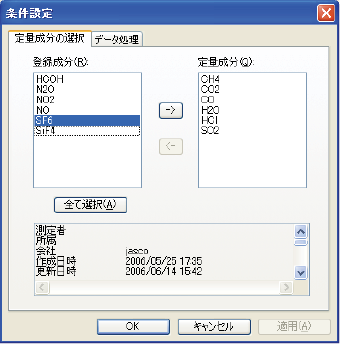
Creation and Selection of Component Calibration Curves
The multi-component quantitative analysis software allows the measurement of up to 20 components. For each quantitative analysis, a calibration curve is selected from the calibration curves that have been created. Figures 4 and 5 show the creation and selection dialogs.
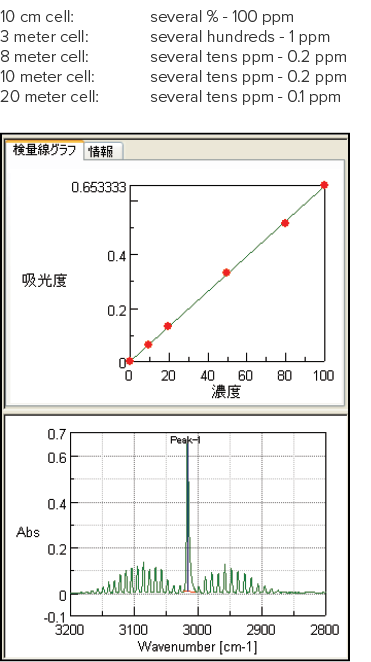
Figure 6 shows a methane spectrum and an example of a calibration curve made using an 8m gas cell. The detection limits are dependent on the individual component gas, sample matrix and measurement conditions, including the resolution, number of accumulations and detector. Examples of typical quantitation ranges with respect to gas cell path length are shown below. [These are typical detection limits only and should be verified by actual experimental data according to test requirement.]


 properties of platinum complexes using a CPL measurement system and a spectrofluorometer")

