Introduction
An FTIR microscope can be used for mapping measurement, which provides an ‘image’ of the distribution of chemical structure at the surface of a material. This can be useful for many different applications.
Using a linear array detector can shorten the measurement time by more than an order of magnitude in comparison with conventional systems and makes FTIR microscopy a more favorable technique.
The powerful IQ Mapping system was developed for two reasons, the first to allow mapping of samples that can be easily damaged or is moved by the frequent lift and replace measurement required to map an image using an ATR. This is useful for soft materials, textile threads or suspended particles. The second is to eliminate the requirement of a more expensive autostage. IQ Mapping can be used with ATR, transmittance or reflectance to map an area using a manual stage by precisely a controlled rastering mirror which directs the IR beam through the cassegrain across the sample surface. Below is an example of impurity analysis using IQ Mapping.
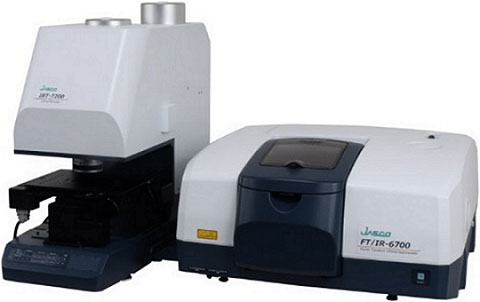
Figure 1. IR microscope system (FT/IR-6700 with IRT-7200)
Experimental
Measurement 1: Mapping by manual stage
Mapping measurement was implemented for multi-layer film.
<Measurement conditions>
Mode: Transmittance
Detector: Mid-MCT
Resolution: 4 cm-1
Accumulation: 1
Cassegrain: 16x
Aperture:50 x 50 µm
Measurement points: 9 x 9
Sampling area: 400 x 400 µm
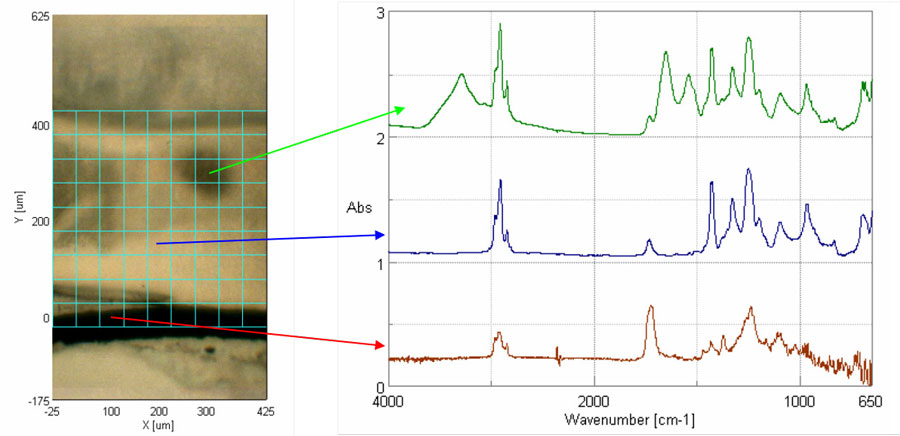
Figure 2. Observation image (Left: Yellow-green grid = measurement points) and individual spectra (Right: extracted from 3 points in mapping array indicated 3 unique species)
By analyzing the spectra in Figure 2 (right), it was confirmed that the multi-layer film consists of three components, PVA (red), PVC (blue), and protein (green). Using a color distribution map to identify key peaks for each component on the RGB display (Figure 3), the component distribution is readily visualized, this enables quick and easy detection of impurities that cannot be identified by a simple visual inspection of the sample.
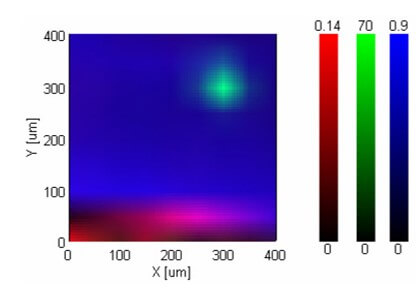
Figure 3. Mapping image with unique band selected for each component assigned a specific color to provide quick visual identification of each species
Measurement 2: ATR Mapping
Combining IQ Mapping with ATR enables mapping without cross contamination caused by repeatedly touching the ATR to the sample. IQ mapping requires only a single touch point and is able to create a map by precisely directing light through an array of positions (up to 400 x 400 μm with a wide angle ATR) on the crystal. The sample shown in Figure 4 was measured using a ZnSe ATR prism.
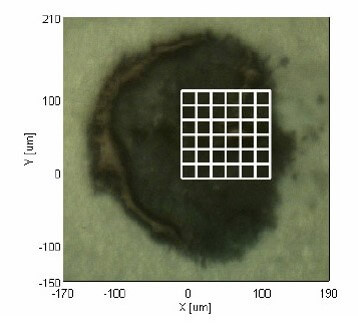
Figure 4. Sample observation image (White grid = measurement points)
<Measurement conditions>
Detector: MCT-N
Resolution: 8 cm-1
Accumulation: 8
Cassegrain: ATR-Z-5000
Aperture: 20 x 20 µm
Measurement points: 6 x 6
Sampling area: 100 x 100 µm
Analysis of the spectra in the mapped area reveals two different components that appeared by visual inspection to be uniform, as shown in the visible image in Figure 4. The sample was a mixture of water-based and oil-based marker, and specific peaks for each could be identified as shown in Figure 5 (left). The color distribution map used uniquely identifying peaks for each component (1666 cm-1 and 1282 cm-1) to delineate the areas where each component was present, this is shown in Figure 5 (right). With the appropriate software tools and the ease of use of IQ mapping, users can rapidly detect non-homogeneity in samples which may appear to be a single component by visual inspection, providing confidence needed for highly accurate qualitative analysis.
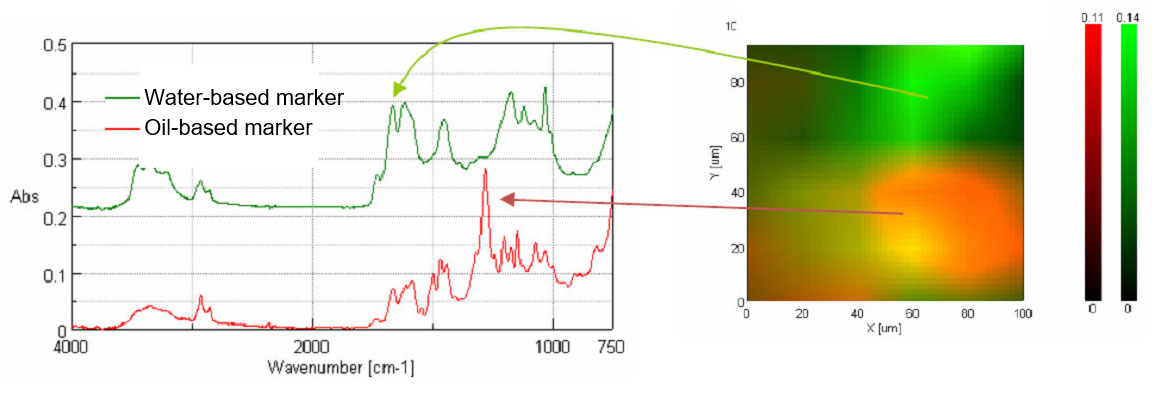
Figure 5. Spectra of impurity (left) and color distribution map (right)


 properties of platinum complexes using a CPL measurement system and a spectrofluorometer")