Introduction
Some white LEDs consist of two types of materials: a luminescent diode that emits a blue light in the near-UV region, and a phosphor that emits visible light from the absorption to the near-UV region. Determining a phosphor’s internal quantum efficiency is an important parameter in evaluating the emission efficiency of a white LED, and the standards about its evaluation method (JIS R1697/ISO 20351) have been published. This article illustrates the measurement reproducibility of the internal quantum efficiency of two phosphor powders from the evaluation of a white LED by using the dedicated system which is compliant with JIS R 1697 /ISO 20351.
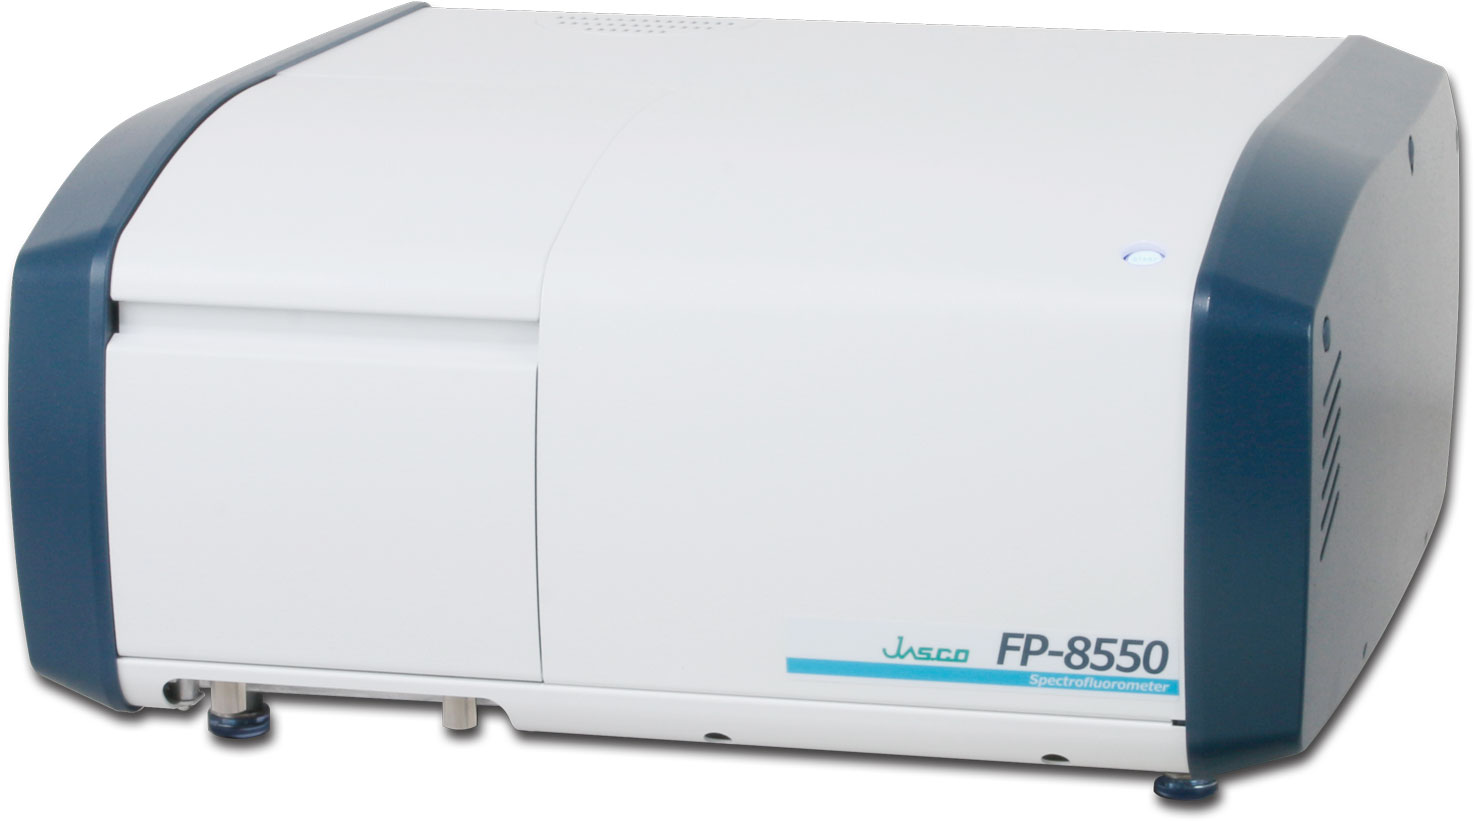
FP-8550 Spectrofluorometer
Experimental
To calculate the internal quantum efficiency, both the sample spectrum and incident light spectrum must be measured. The incident light spectrum is the emission spectrum of the excitation light scattered by a BaSO4 reflectance standard, shown in Figure 1. A calibrated light source is then used for spectral correction of the measured spectrum.
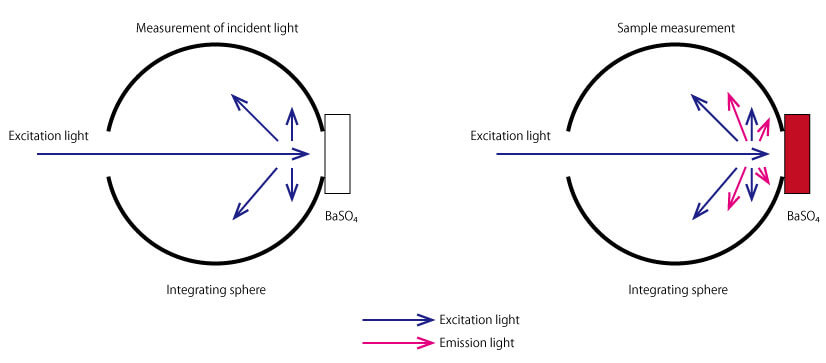
Figure 1. Measurement of the incident light (left) and sample fluorescence and excitation scattered light using the integrating sphere.
Keywords
Calibrated WI light source, Integrating sphere, Phosphors, Materials, Fluorescence, Internal quantum yield, Quantum Yield Calculation program
Results
To confirm reproducibility, five repeat measurements were made for each sample (by refilling the sample cell) and are shown in Figure 2 and 3. High reproducibility was obtained for both phosphor measurements as indicated by the difference between the maximum and minimum values of the internal quantum efficiency (within 1.5% with a coefficient of variance of 0.6%), shown in Table 1 and 2.
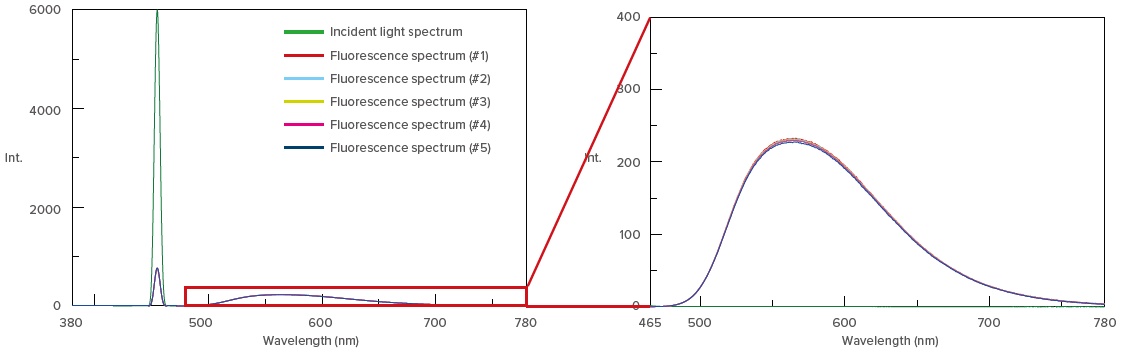
Figure 2. Incident light spectrum and fluorescence spectrum of yellow phosphor
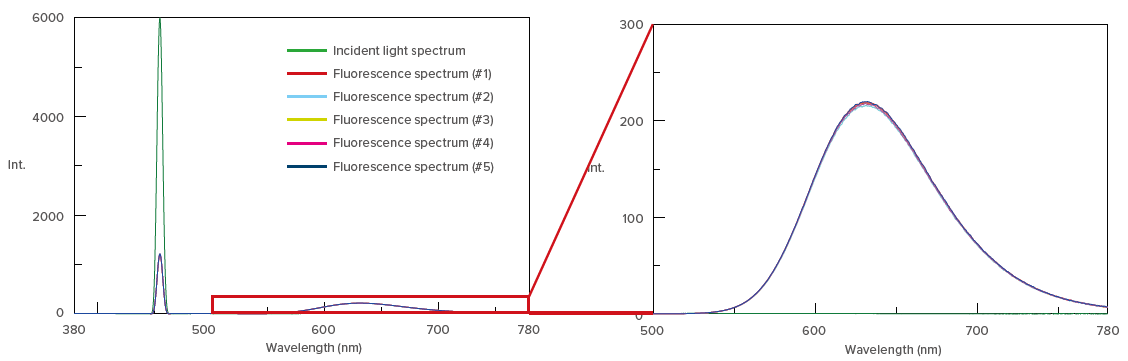
Figure 3. Incident light spectrum and fluorescence spectrum of red phosphor
Table 1. Calculated results of the internal quantum efficiency of the yellow phosphor.
| Light volume absorbed by sample (%) | External Quantum Efficiency (%) | Internal Quantum Efficiency (%) | |
| 1 | 87.6 | 80.7 | 92.1 |
| 2 | 87.4 | 80.3 | 91.9 |
| 3 | 87.3 | 79.9 | 91.6 |
| 4 | 87.2 | 79.7 | 91.4 |
| 5 | 87.1 | 79.0 | 90.7 |
| Average | 87.3 | 79.9 | 91.5 |
| SD | 0.19 | 0.64 | 0.54 |
| C.V. | 0.22 | 0.80 | 0.59 |
Table 2. Calculated results of the internal quantum efficiency of the red phosphor.
| Light volume absorbed by sample (%) | External Quantum Efficiency (%) | Internal Quantum Efficiency (%) | |
| 1 | 78.2 | 65.8 | 84.1 |
| 2 | 77.6 | 64.9 | 83.6 |
| 3 | 77.9 | 65.9 | 84.6 |
| 4 | 77.8 | 65.4 | 84.1 |
| 5 | 77.9 | 66.1 | 84.9 |
| Average | 77.9 | 65.6 | 84.3 |
| SD | 0.22 | 0.48 | 0.50 |
| C.V. | 0.28 | 0.73 | 0.60 |


