Introduction
Infrared spectroscopy is an effective method for analysing the composition of biological samples such as proteins, sugars, and lipids, and also interactions between them. However, using conventional Fourier-transform infrared (FTIR) spectroscopy, it is difficult to analyse sample solutions with low concentrations of 0.01 to 0.1%, which are common in protein research. For such samples, transmission measurements are challenging, and the sensitivity of conventional ATR methods is insufficient for acquiring high-quality spectra. To address these problems, we have developed a new multi-reflection high-sensitivity ATR unit.
JASCO FTIR spectrometer
High-sensitivity ATR prism
We developed a high-sensitivity ATR prism involving 14 optical reflections for installation inside the FTIR sample chamber. The optical path in the prism is shown below.
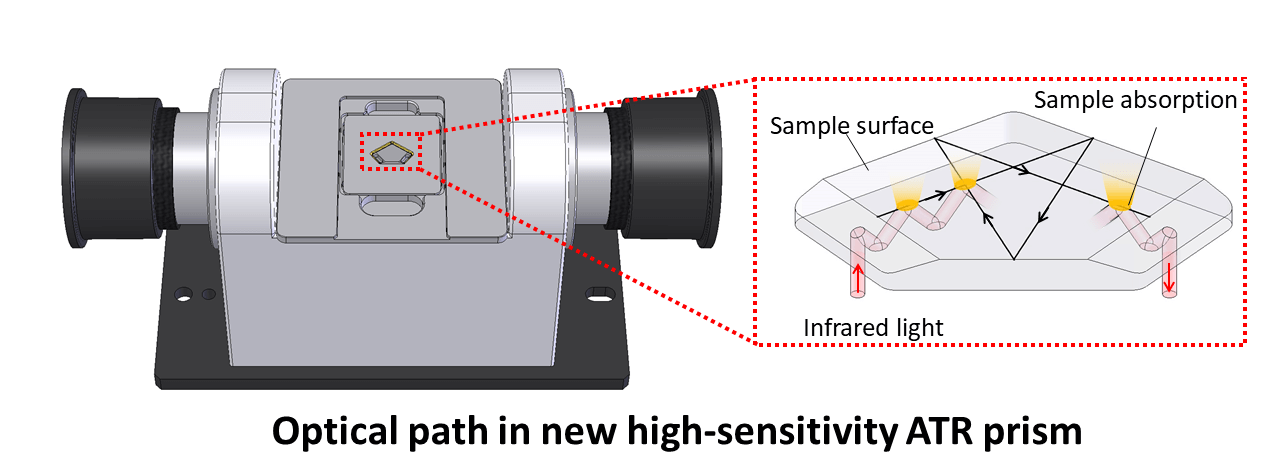
| Prism material | Ge |
| Number of reflections | 14 |
| Incidence angle | 45º |
| Detector | MCT-PV |
Experimental
Comparison of high-sensitivity ATR and single-reflection ATR
Difference spectra* for a 0.1% lysozyme aqueous solution measured by high-sensitivity ATR and single-reflection ATR are shown below. For ease of comparison, the single-reflection spectrum is magnified by a factor of 14.
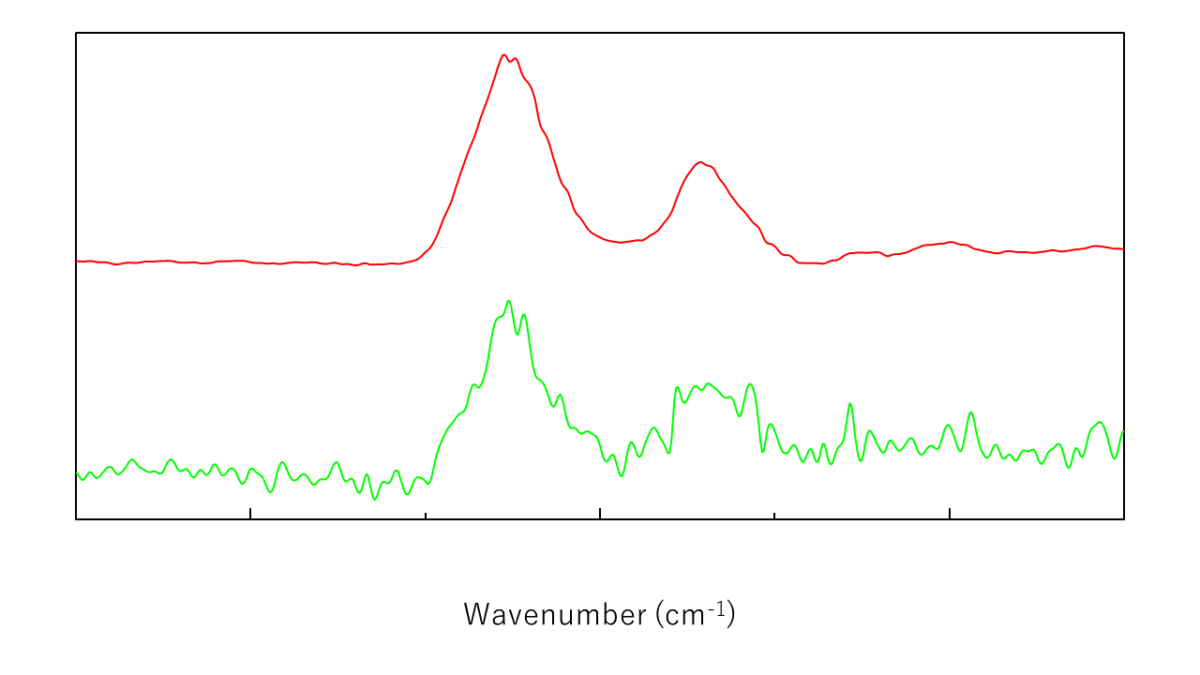
Difference spectra for lysozyme aqueous solution measured using high-sensitivity ATR and single-reflection ATR
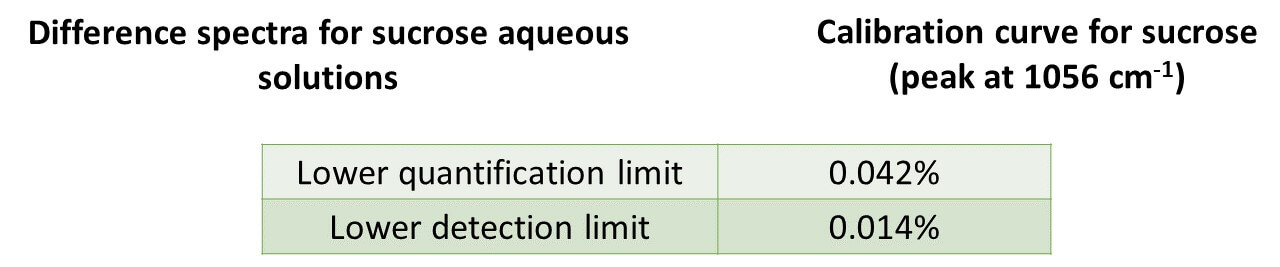
Lower limits for detection and quantification of sucrose aqueous solution
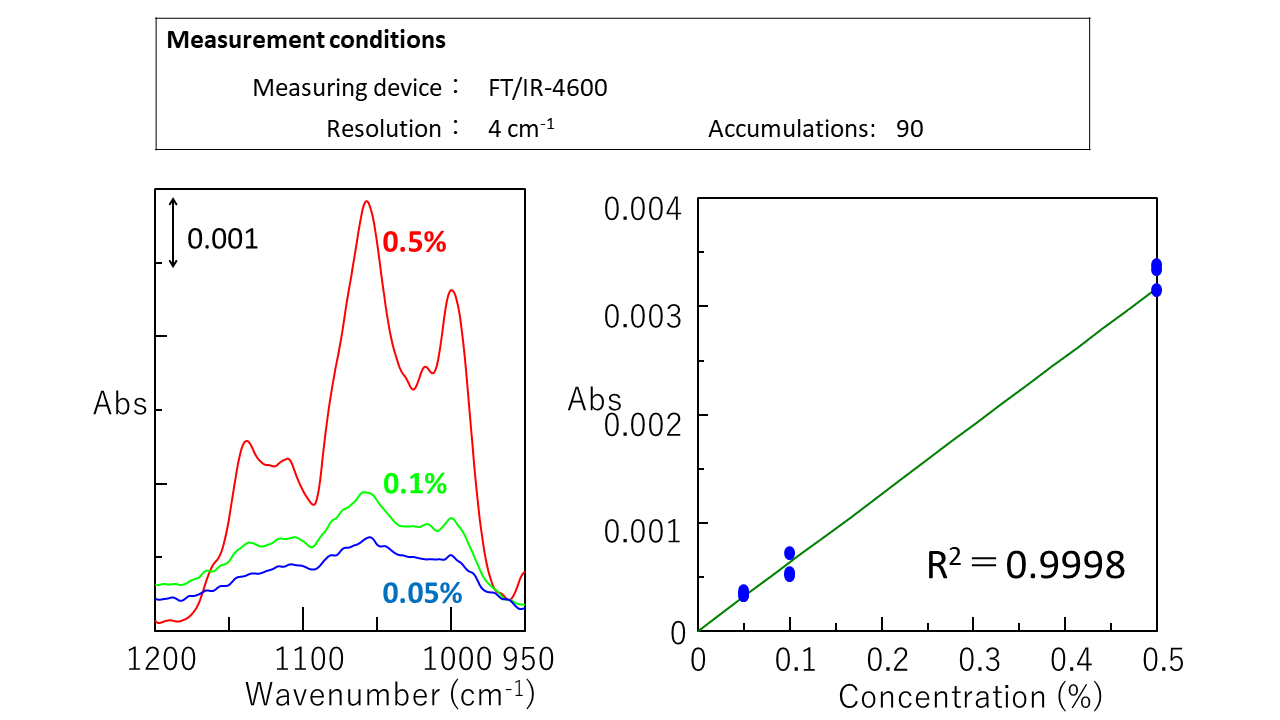
Difference spectra* for 0.05%, 0.1%, and 0.5% sucrose aqueous solutions are shown below, together with a calibration curve based on the peak at 1056 cm-1. It can be seen that there is a good correlation between the peak height and the solution concentration. The calculated lower detection limit (3s) and lower quantification limit (10s) based on the noise level were 0.014% and 0.042%, respectively.
Measurement of lysozyme heavy aqueous solution
The difference spectrum* for a 0.01% lysozyme aqueous solution and protein secondary structure estimation analysis (SSE) spectra using the amide-I band are shown below. The fractions of α-helix and β-sheet components were calculated to be 40% and 22%, respectively, which are in reasonable agreement with the values of 36% and 10% obtained by Sarver et al.1)
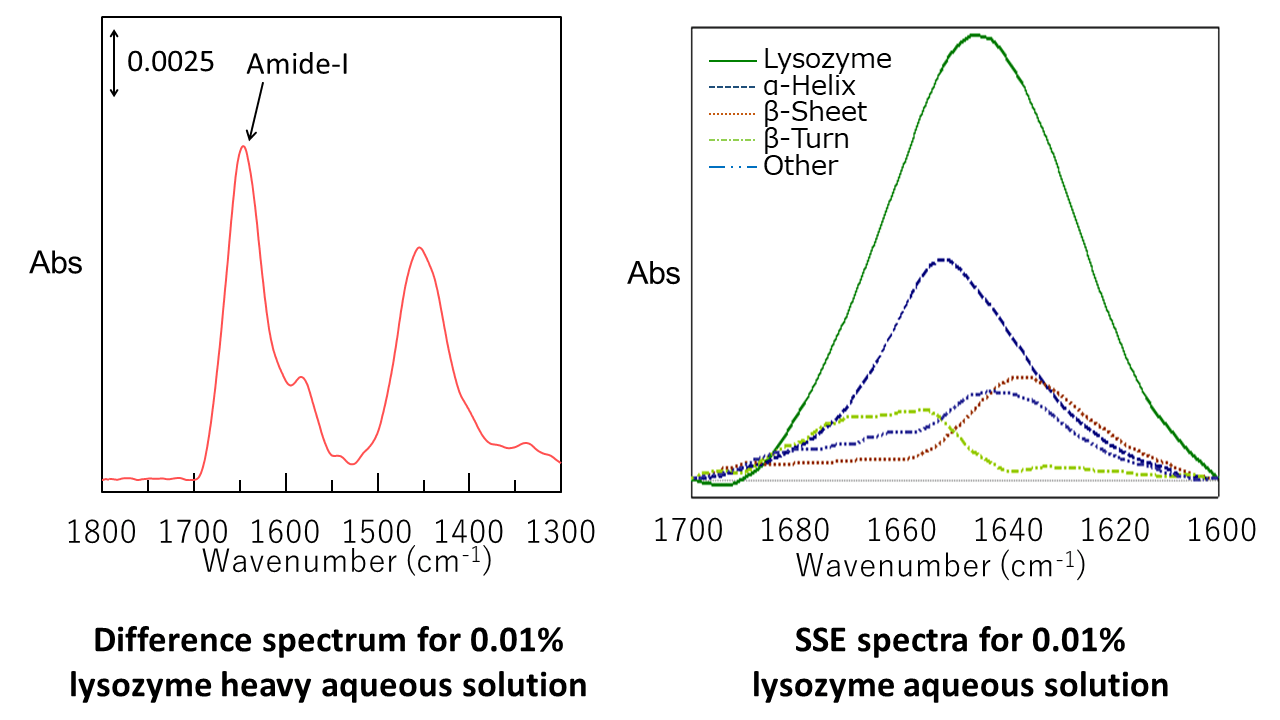
| Structure | Fraction (%) |
|---|---|
| α-Helix | 40 |
| β-Sheet | 22 |
| β-Turn | 18 |
| Other | 20 |
Conclusion
・We developed a high-sensitivity ATR prism.
・For a sucrose aqueous solution, a calibration curve with good linearity was obtained, and the detection limit was found to be 0.014%.
・Detection of lysozyme at a concentration of 0.01% was possible, and an SSE analysis was performed based on the Amide-I band in the difference spectrum.
The newly developed high-sensitivity ATR prism is a promising tool in biochemistry fields such as lipids, saccharides and proteins.
* Calculated by subtracting the solvent spectrum from the aqueous solution spectrum.
References
[1] Sarver, R. W., Krueger, W. C., 1991. Anal. Biochem., 194, 89-100.
Author
Higuchi, Yuji; Kanno, Miyuki; Onishi, Inori; Ito, Chisato; Watanabe, Keisuke
JASCO Corporation
This application was introduced at ICAVS 10 in New Zealand.
Related Posts:
 Microplastics Identification using Macro-ATR Unit…
") Analysis of Ultraviolet Absorbers in Sunscreen Cream…
Analysis of Ultraviolet Absorbers in Sunscreen Cream… Vibrational Circular Dichroism Spectrometer based on…
 Highly efficient spectral measurement methods using…
 Optical Rotation Measurement for High-concentration…
 Analysis of CBN-Binding DNA Aptamer using CD Spectroscopy") Higher-Order Structure (HOS) Analysis of CBN-Binding…
Higher-Order Structure (HOS) Analysis of CBN-Binding…