
Introduction
In the research and development of chiral pharmaceuticals and functional organic molecules, the preparation of enantiomerically pure compounds and their stereochemical characterization are essential. High-performance liquid chromatography (HPLC) using chiral stationary phases, which offers high resolution, reproducibility, and versatility, is widely used as a key analytical technique for the separation of enantiomers.[1] However, efficient screening is required to rapidly determine the optimal mobile phase and chiral stationary phase for various chiral compounds.
In this regard, supercritical fluid chromatography (SFC), which provides higher throughput and resolution than HPLC, is particularly effective because it can reduce the analysis time required for method screening.[2,3] After identifying the optimal separation conditions (mobile phase and column) using analytical-scale SFC, the method is scaled up to preparative SFC, and each eluted peak is collected and concentrated to obtain the enantiomers. The enantiomers obtained by preparative SFC are subsequently subjected to structural analysis using techniques such as circular dichroism (CD) spectroscopy, nuclear magnetic resonance (NMR) spectroscopy, and X-ray diffraction (XRD). As mentioned above, the isolation and structural analysis of enantiomers are generally performed offline. However, performing these procedures offline is time-consuming and laborious and generally requires larger sample amounts; therefore, the development of hyphenated techniques that combine separation and structural analysis online is expected.
In this study, a hyphenated system was established by online coupling SFC with electronic circular dichroism (ECD) spectroscopy. ECD spectroscopy is particularly advantageous for chiral analysis compared with other structural characterization techniques, because it provides stereochemical information in solution without the need for crystallization and requires only a small amount of sample. Furthermore, its optical detection principle facilitates online coupling with chromatographic techniques. This system enables the real-time acquisition of high-quality CD spectra simultaneously with chromatograms, allowing the chiral information of each peak to be directly evaluated without fractionation. As a result, sample consumption and analysis time can be significantly reduced, enabling faster and more efficient structural analysis in the study of chiral compounds. In this presentation, examples of the application of this system to several chiral compounds (flavanone, warfarin, and bromuconazole) will be presented. Flavanone and warfarin each exists as two enantiomers, whereas bromuconazole exists four stereoisomers because it contains two independent chiral centers.
Experimental
Figures 1 and 2 show a schematic diagram of the SFC-ECD system and the appearance of the instruments. The ECD spectrometer was integrated into the column-screening system of the analytical SFC. The enantiomers of a chiral compound, separated by the SFC, were trapped in a high-pressure cell mounted on the ECD spectrophotometer via a switching valve installed between the PDA detector and the back pressure regulator, and their CD spectra were subsequently measured. The PDA detector was used to verify the chromatographic separation and to control the timing of the switching valve.The valve was switched around the peak top of each eluting peak on the chromatogram recorded by the PDA detector, thereby trapping each peak in the cell of the ECD spectrometer.
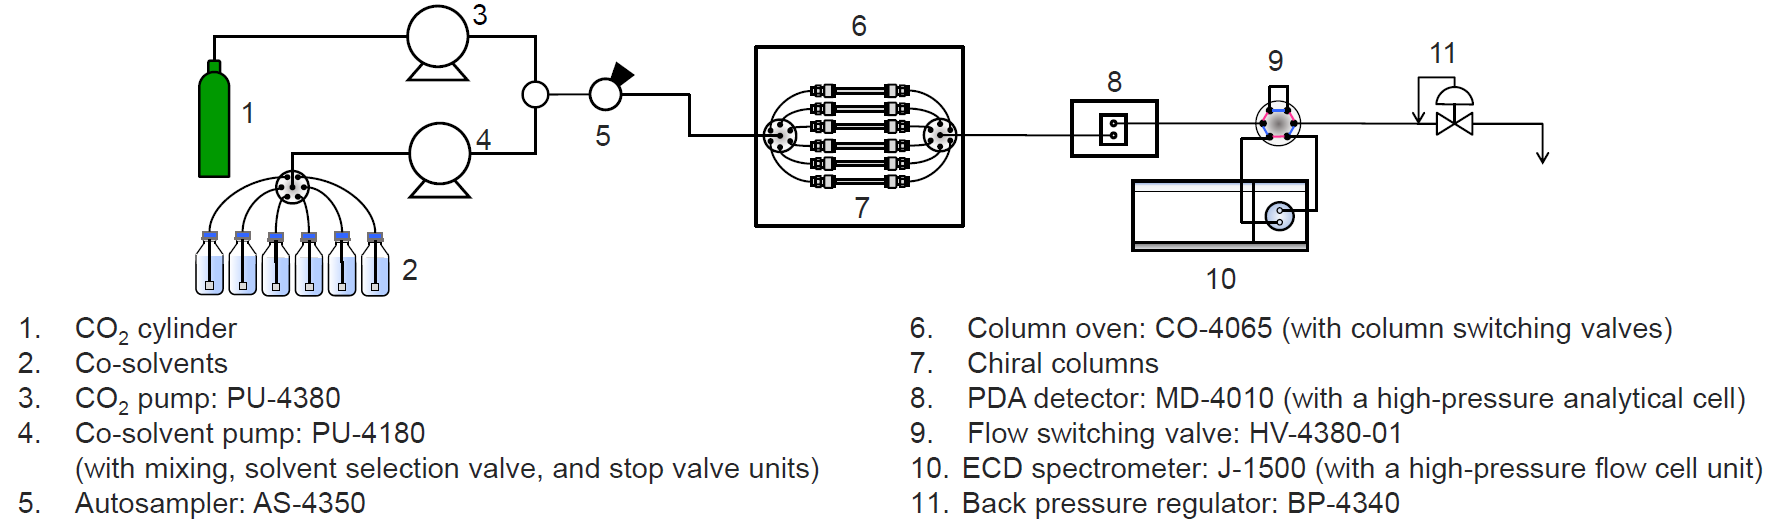
Fig. 1 Schematic diagram of the SFC-ECD system
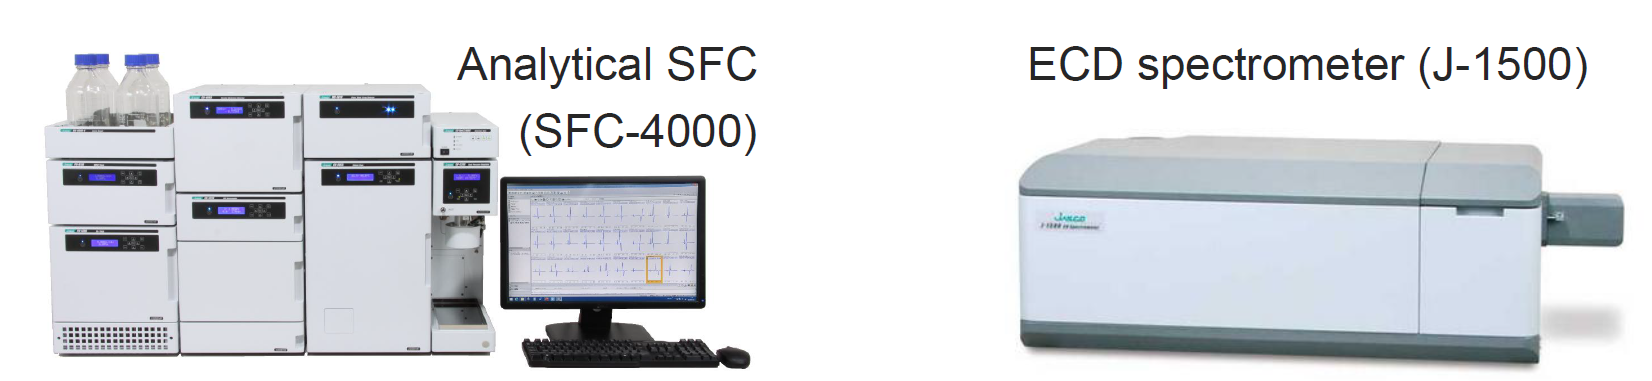
Fig. 2 Appearance of an analytical SFC and an ECD spectrometer
Results
Figures 3 to 5 show the chromatograms of flavanone, warfarin, and bromuconazole obtained by the PDA detector, along with the CD and UV spectra of each separated enantiomer peak measured online using the ECD spectrometer. High-precision CD spectra were successfully obtained for each sample.
Conventionally, CD spectra of enantiomers could only be obtained after chiral separation, fractionation, and off-line CD measurement. In contrast, the present system enables direct online acquisition of CD spectra during chromatographic analysis, thereby improving analytical efficiency. In combination with the screening system, optimal separation conditions and CD spectra can be obtained simultaneously.
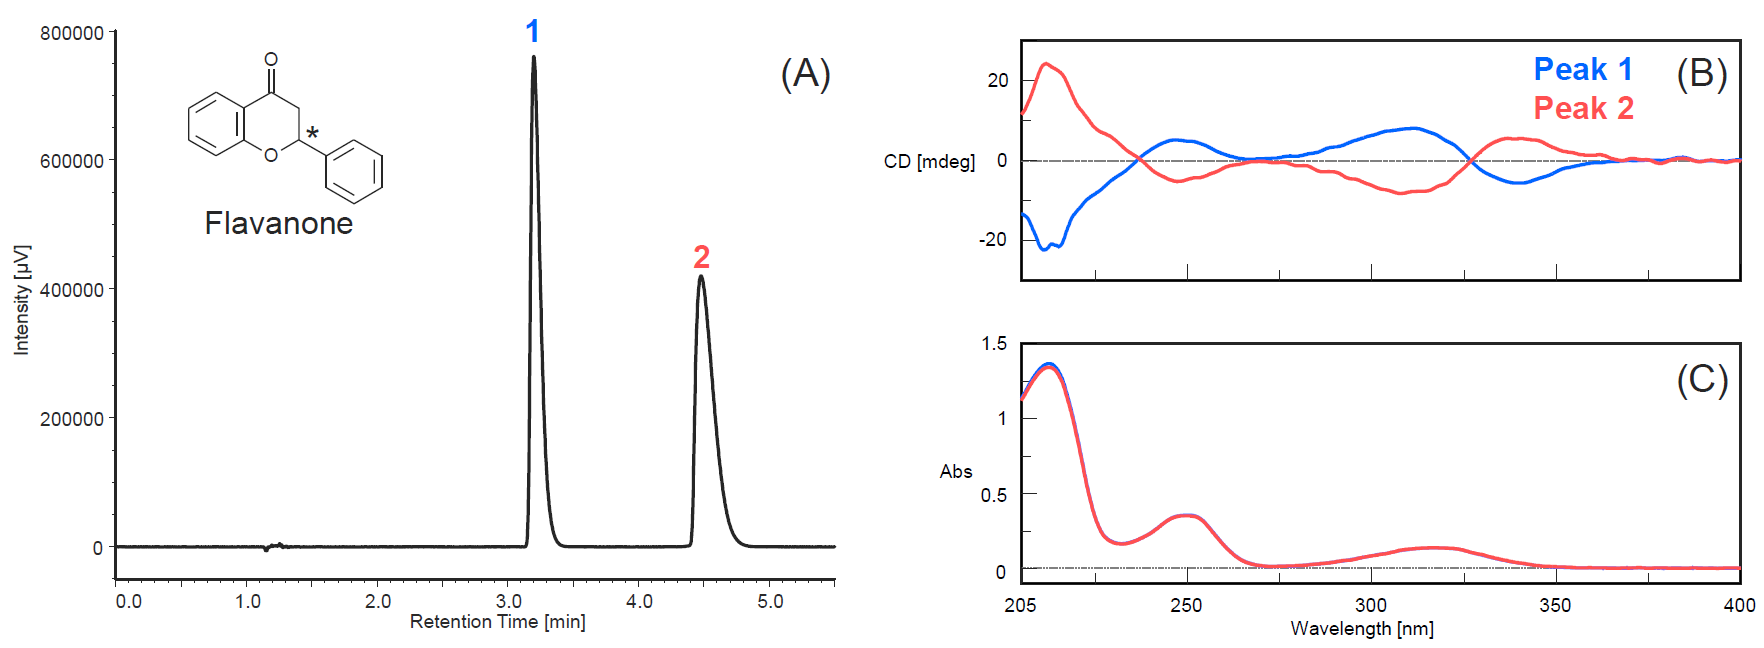
Fig. 3 Results of flavanone ((A) Chromatogram, (B) CD Spectra, (C) UV spectra)
Column: CHIRALPAK IA (4.6 mmI.D. x 250 mmL, 5 μm), CO2 flow rate: 2.0 mL/min, Methanol flow rate: 0.5 mL/min, Column temperature: 40 ºC, Pressure: 15 MPa, PDA wavelength: 250 nm, Injection volume: 10 μL, Sample: 1.0 mg/mL of racemic flavanone in methanol
* CHIRALPAK is a trademark and/or registered trademark of Daicel Corporation.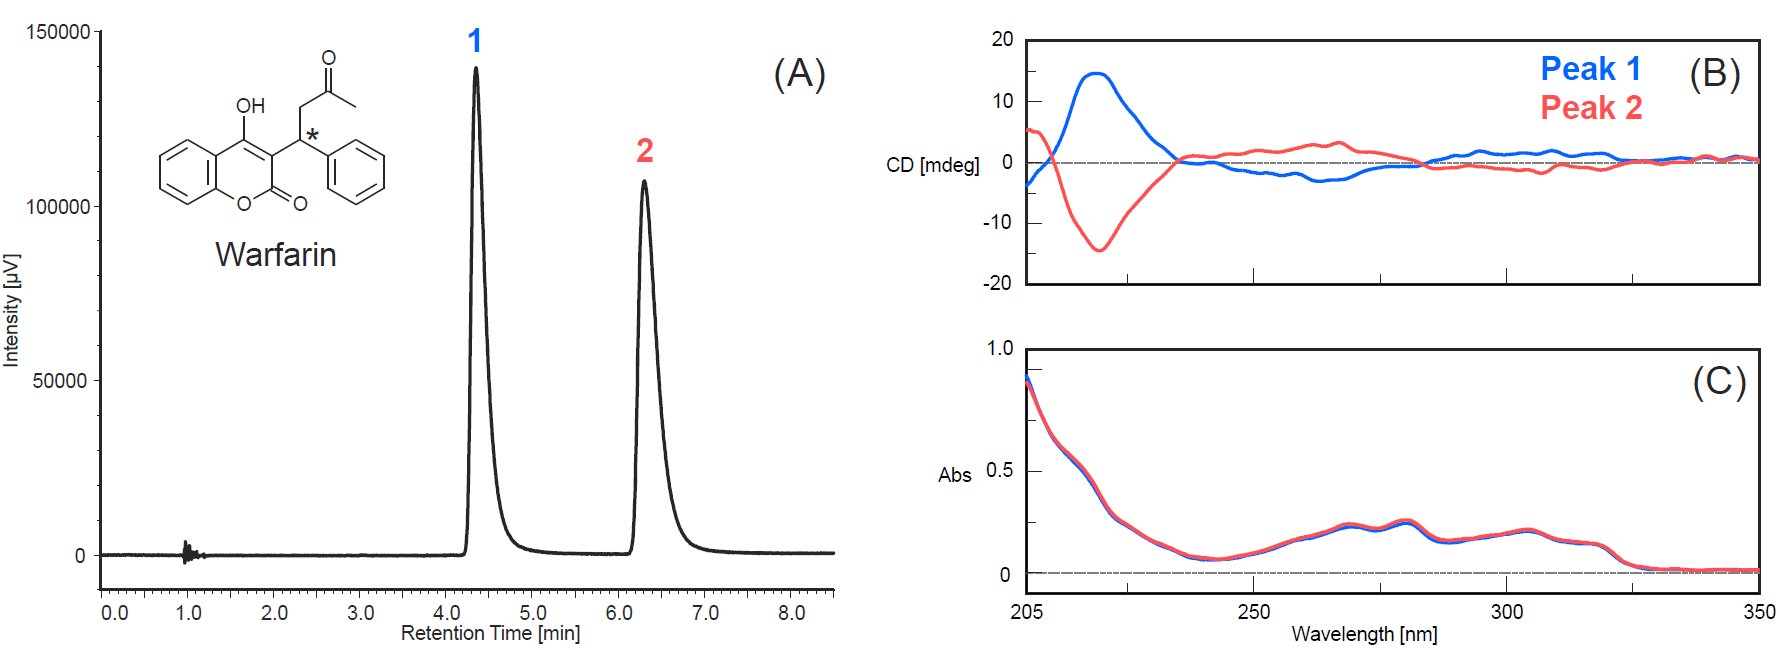
Fig. 4 Results of warfarin ((A) Chromatogram, (B) CD Spectra, (C) UV spectra)
Column: CHIRALPAK IA (4.6 mmI.D. x 250 mmL, 5 μm), CO2 flow rate: 2.5 mL/min, Methanol flow rate: 0.5 mL/min, Column temperature: 40 ºC, Pressure: 15 MPa, PDA wavelength: 250 nm, Injection volume: 10 μL, Sample: 1.0 mg/mL of racemic warfarin in methanol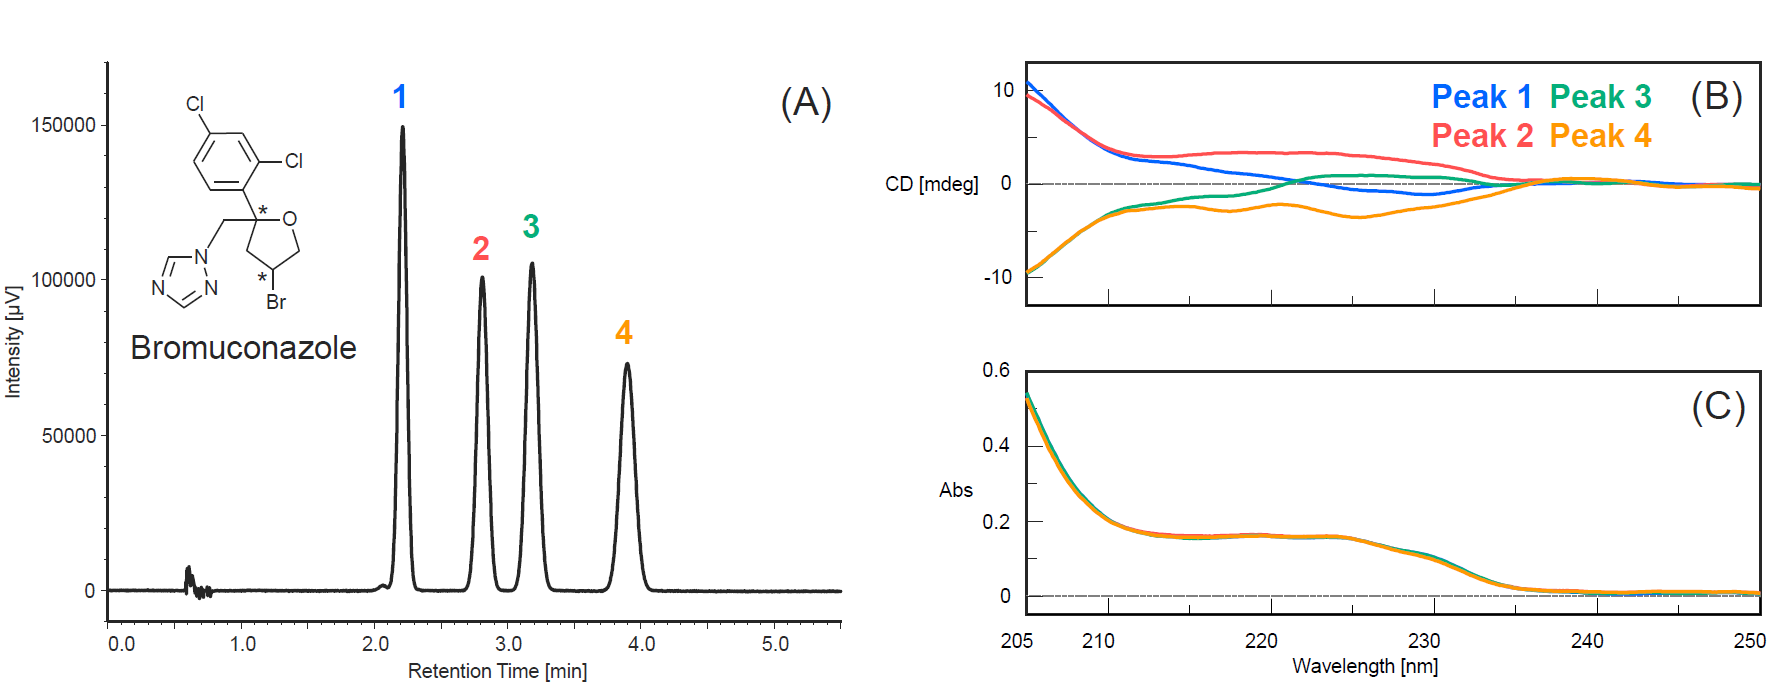
Fig. 5 Results of bromuconazole ((A) Chromatogram, (B) CD Spectra, (C) UV spectra)
Column: CHIRALPAK IH (4.6 mmI.D. x 150 mmL, 5 μm), CO2 flow rate: 2.7 mL/min, Methanol flow rate: 0.3 mL/min, Column temperature: 40 ºC, Pressure: 15 MPa, PDA wavelength: 230 nm, Injection volume: 10 μL, Sample: 1.0 mg/mL of racemic bromuconazole in methanol
As one of the detectors used in HPLC and SFC, there is a CD detector (CD-4095) that can selectively detect chiral compounds. Although this detector is capable of measuring CD spectra, it is specifically optimized for highly sensitive CD detection of chromatographic peaks. Consequently, while it excels at detecting CD signals in chromatograms, it has a limitation in that it is less suitable for measuring CD spectra in the short-wavelength region.
Figures 6 and 7 shows the CD spectra of flavanone and bromuconazole measured by the CD detector and the ECD spectrometer, respectively. For compounds such as flavanone which exhibit strong CD signal, there is no difference between the CD detector and the ECD spectrometer.
For compounds such as bromuconazole, which exhibit weak CD signals and absorb only in the low-wavelength range, measurements using the CD detector tend to suffer from high noise levels, making it difficult to obtain high-precision spectra. On the other hand, measurements using the ECD spectrometer enable detection down to 200 nm and allow the acquisition of high-quality spectra.
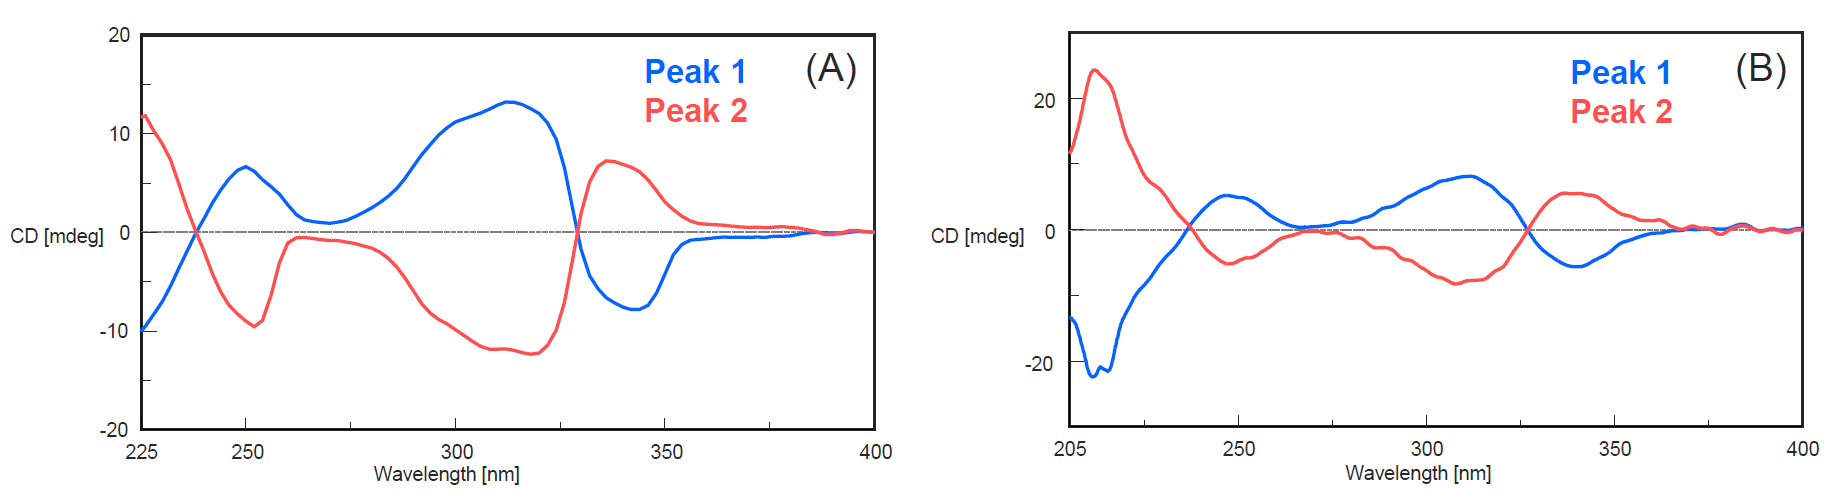
Fig. 6 CD spectra of flavanone ((A) by CDdetector, (B) by ECD spectrometer)
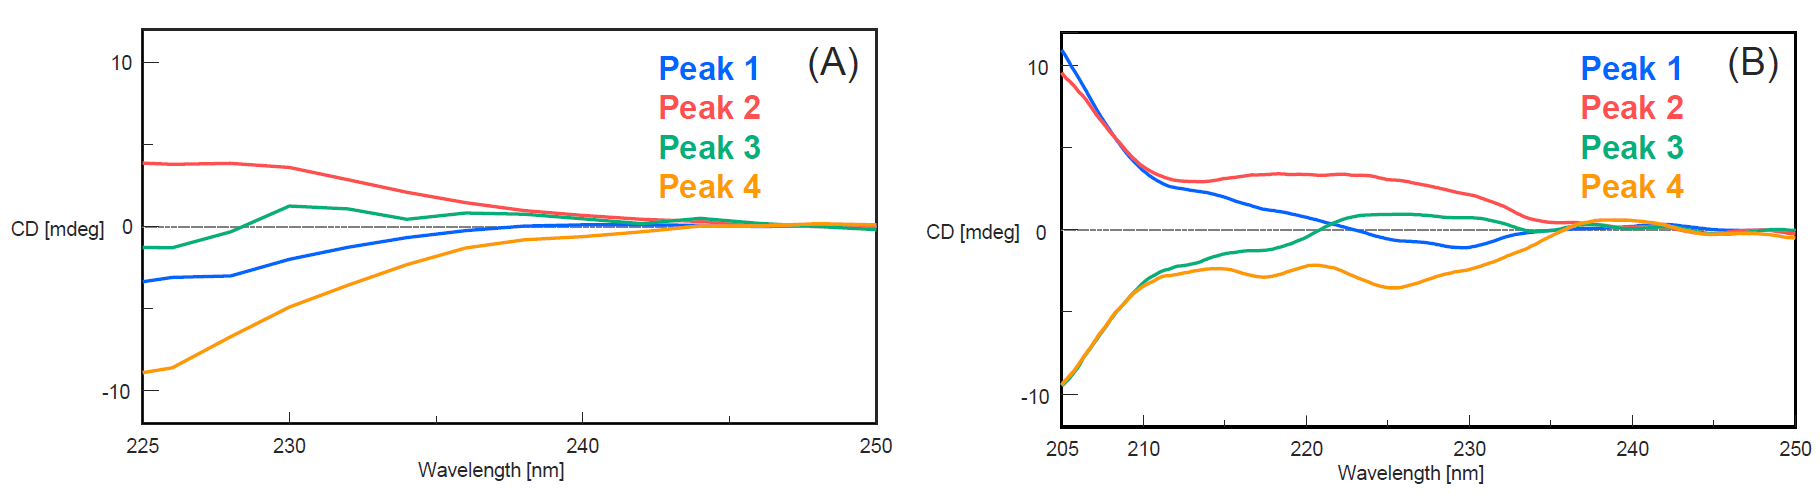
Fig. 7 CD spectra of bromuconazole ((A) by CD detector, (B) by ECD spectrometer)
Conclusion
⚫A hyphenated analytical system combining SFC and ECD spectroscopy was successfully developed, enabling simultaneous chromatographic separation and high-quality CD spectral acquisition.
⚫Peak detection using a PDA detector and valve switching allowed each separated enantiomer to be trapped in the ECD cell, enabling rapid and efficient acquisition of stereochemical information.
⚫Compared with conventional offline CD measurements, the system significantly reduced sample consumption and analysis time, while providing high-quality spectra even for compounds with weak CD signals.
References
Poster Session at 36th International symposium on Chirality (Chirality 2026, July 14 – 17, 2026, in Santiago de Compostela, SPAIN)
Satoe Iijima, Yoshiteru Horikawa, Kengo Yoshida, Akio Kaneta, Yoshiro Kondo, Satoko Suzuki, and Kenichi Akao
JASCO Corporation, Hachioji, Tokyo 192-8537, Japan
[1] Okamoto, Y.; Ikai, T.; Chem. Soc. Rev., 2008, 37, 2593-2608.
[2] De Klerck, K.; Mangelings D.; Vander Heyden, Y.; J. Pharm. Biomed. Anal., 2012, 69, 77-92.
[3] West, C.; TrAC Trends in Anal. Chem., 2019, 120, Article 115648.
Related Posts:
 Structural Analysis of Chiral Samples with Multiple…
 Increased Productivity of Chiral Separation in…
 Chiral preparative separation of warfarin using…
 Rapid Column Screening for Chiral Separation by Parallel SFC
 Vibrational Circular Dichroism Spectrometer based on…
 Evaluation of Higher-Order Structure and Stability…