Introduction
The Iodine Value (IV) is used as an index for the degree of unsaturation in fats, and is used for evaluating the nature of fatty oils and bio-diesels. The iodine value is typically measured using a wet chemistry method as described in the standard methods of ASTM D5554, JIS etc., which is based on a redox reaction. However, this method is quite complicated. A simpler method using vibrational spectroscopy (IR and Raman) for the estimation of the Iodine value or degree of unsaturation has been proposed (refer to 050TR0125 FT/IR Application Data). This application note has been developed to evaluate the measurement accuracy of the iodine value using a dedicated FT-NIR (Fourier Transform Near Infrared Spectrometer), compared to the traditional wet chemistry method. The FT-NIR spectrometer was fitted with an air-cooled Peltier thermostated sample cell holder to ensure the samples were measured in liquid phase.
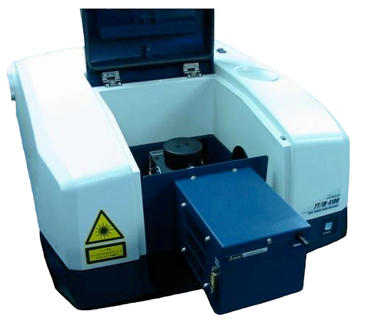
Figure 1. FT-NIR system with thermostated cell holder for Iodine value (IV) measurement
A calibration curve was calculated using the partial least squares PLS method from NIR spectra of fatty oils measured with the system, this data was compared to the Iodine values obtained using a conventional wet method. The calibration curve data was used to show the effectiveness of the system by applying it to actual samples.
Experimental
Firstly, 24 different fatty oils with various Iodine values were measured (in duplicate) and the NIR spectra used to calculate a calibration curve model. Next, the calibration curve model generated using the PLS method was applied to measured spectra and the calculated Iodine values were correlated with the wet chemistry method. Finally, the Iodine values of 5 actual samples were measured utilizing this calibration curve model.
| Measurement Conditions | |||
| LightSource | High-Intensity Ceramic Source | Temperature Control | EHC-716 Air-cooled Peltier (customized) |
| Detector | DLATGS | Temperature Setting | 60°C (samples were solid at room temperature and temperature was set at higher than the melting point) |
| Accumulations | 16 | Photometric Mode | Transmittance |
| Resolution | 8 cm -1 | Cell | Quartz Cell, 5 mm pathlength |
Keywords
Iodine, unsaturated fats, FT-NIR, ASTM D5554, partial least squares, chemometrics
Results
Figure 2 shows the NIR spectra of 24 fatty oils, from this data a calibration curve model was generated using a PLS method in the wavenumber range 4500 to 4800 cm-1.
Figure 2. NIR spectra of 24 different fatty oils
Figure 3 shows the PLS calibration curve model which gives good correlation between the ‘true’ value (obtained by wet chemical method) and evaluated value (obtained by spectral analysis). The correlation coefficient is 0.9995. The results of evaluating the quantitation reproducibility (n=30) of 5 different fatty oils with different Iodine values using this model are shown in Table 1. The average value and the standard deviation obtained from the spectra are presented in the table. The values in parentheses are Iodine values obtained by wet analysis method.
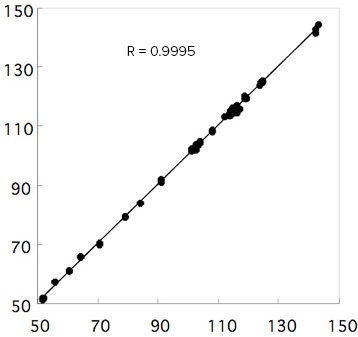 Figure 3. PLS calibration curve model
| Sample | A (102.6) | B (115.7) | C (56.3) | D (123.8) | E (116.7) |
| Average | 119.0 | 123.7 | 56.4 | 115.6 | 103.5 |
| Standard Deviation | 0.161 | 0.171 | 0.135 | 0.173 | 0.141 |
| Values in……: Iodine values obtained by wet analysis method (Standard fatty oil analysis method established by Japan Oil Chemists’ Society: Wijs-Cyclohexane method) | |||||
The error between the results obtained with the two analysis methods is less than 2% and the standard deviation of the reproducibility is less than 0.173, which can be considered as a excellent result.
The results demonstrate that the an FT-NIR spectrometer with high wavenumber accuracy, fitted with a Peltier thermostated cell holder to control the sample temperature is very effective for measurement of the iodine value. It provides comparable data quality to the wet chemistry method, but is much more convenient, being simpler, faster and nondestructive.


