Introduction
Phthalocyanines have been extensively investigated for materials science and biomedical applications, including magnetooptic devices, inks, solar cells, photocatalysts and photodynamic therapy (PDT).1-5) In the development of these photophysical materials, it is important to understand their detailed electronic structures and magnetic properties. Magnetic circular dichroism (MCD) spectroscopy is known to provide insights into the electronic structure, molecular symmetry, and magnetic properties of molecules, and is widely used to characterize molecules with highly symmetric structures, such as phthalocyanines and porphyrins.1-11) While ordinary circular dichroism (CD) is a property unique to molecules with chiral structures, MCD is due to a change in the electronic state of a molecule in the presence of an external magnetic field, such that the molecule interacts differently with left-handed circularly polarized light (lcp light) and right-handed circularly polarized light (rcp light), and all molecules absorbing light at a certain wavelength, whether or not they are chiral molecules, exhibit MCD. In MCD spectroscopy, as illustrated in Figure 1, a CD spectrometer is used to apply a magnetic field to a sample in a Faraday configuration in which the direction of the magnetic field and the direction of light propagation are parallel, and the difference in absorbance of the lcp and rcp light is detected. Then, by analyzing the MCD spectrum and the absorption spectrum obtained using a spectrophotometer, the electronic structure, molecular symmetry, and angular momentum of the molecule can be determined. This report describes the results of an analysis of the electronic structure and orbital angular momentum of zinc phthalocyanine (ZnPc) using MCD and absorption spectroscopy, and by comparing the resulting spectra with calculation results based on time-dependent density functional theory (TD-DFT).

Fig. 1 Schematic of MCD measurement method
Experimental
Sample
Tetrahydrofuran (THF) solution of 1.43 x 10⁻⁶ mol/L zinc phthalocyanine
System
Instruments: J-1500 CD spectrometer, V-750 UV-vis spectrophotometer
Accessory: PMCD-586 Compact permanent magnet
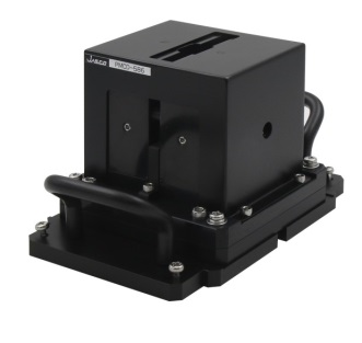
Fig. 2 PMCD-586 Compact permanent magnet
Parameters
<CD spectrometer>
Scan speed: 50 nm/min
Response: 2 sec
Bandwidth: 2 nm
Data interval: 0.1 nm
Optical path length: 5 mm
Magnetic field: 1.6 T
<UV-Vis spectrophotometer>
Scan speed: 50 nm/min
Response: 2 sec
Bandwidth: 2 nm
Data interval: 0.1 nm
Optical path length: 5 mm
Analysis
The MCD spectrum is expressed by the following equation containing Faraday A-, B– and C-terms.6)

Here, γ is a constant, ε is the wavenumber, μB is the Bohr magneton, B is the magnetic field, k is the Boltzmann constant, T is the temperature, and f(ε) is a function describing the normalized band shape.
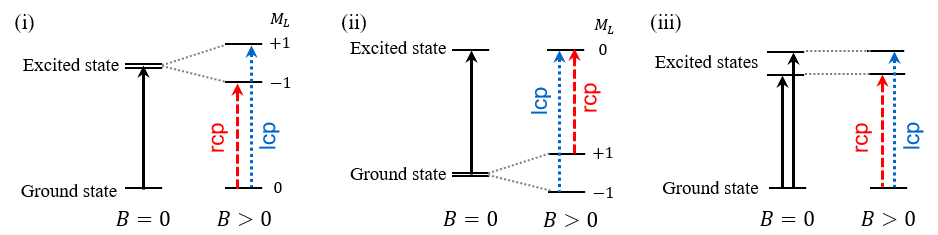
Fig. 3 Electronic transitions from ground state to excited states
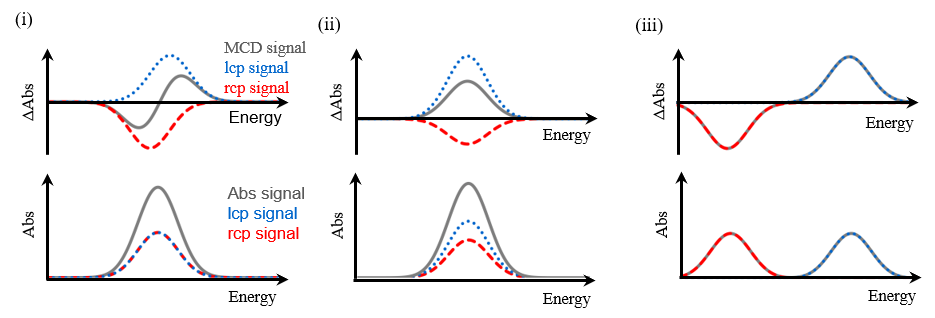
Fig. 4 Faraday (i) A-term, (ii) C-term, (iii) B-term
Since ZnPc was used in this experiment, each term is explained here using an example of a system in which the spin angular momentum is zero (S=0), and therefore the total angular momentum is equal to the orbital angular momentum (J=L). When the excited state is degenerate (Figure 3(i)), a derivative-shaped component associated with the Faraday A-term in equation (1) is observed, as shown in Figure 4(i). This is because when a magnetic field is applied to a molecule, the degeneracy of the excited state is lifted by Zeeman splitting, and the selection rule for electronic transitions is that the change in the total orbital angular momentum, ΔML , is +1 for lcp and –1 for rcp. When the ground state is degenerate (Figure 3(ii)), a bell-shaped component associated with the Faraday C-term is also observed based on the same principles. This is because the C-term originates from the Boltzmann distribution of the degenerate ground states. Therefore, when the ground state is degenerate, its MCD spectrum is the sum of the A-term and C-term components. When the excited states interact with each other in the presence of an applied magnetic field (Figure 3(iii)), a bell-shaped Faraday B-term component is observed as shown in Figure 4(iii). The B- and C-term components exhibit the same bell shape, but the C-term component is temperature dependent, whereas the B-term component is not. Thus, the B- and C-terms can be distinguished by measuring the MCD spectra at cryogenic and room temperature. Additionally, the absorption spectrum Abs(ε) is expressed by the following equation using the dipole strength D0.

To analyze the MCD spectrum, after deconvoluting the MCD and absorption spectra, curve fitting is performed (hereinafter, this analysis is referred to as band deconvolution analysis), and the Faraday terms A1, B0, C0 in equation (1) and the magnitude of the dipole strength D0 in equation (2) are calculated. The following equation can also be used to determine the absolute value of the orbital angular momentum |Lz| for a molecule.

Keywords
Magnetic circularly dichroism, MCD, electronic structure, angular momentum, orbital angular momentum, phthalocyanines, porphyrins
Results
Figure 5 shows the MCD and absorption spectra of a ZnPc solution at room temperature. In the absorption spectrum, a strong band referred to as the Q band is observed at 14940 cm-1, and is associated with electronic transitions from the highest occupied molecular orbital (HOMO) to the lowest unoccupied molecular orbital (LUMO). Additionally, multiple vibronic bands are visible in the higher wavenumber region. The MCD spectrum exhibits a derivative shape in which the signal intensity becomes zero at 14930 cm-1. This indicates that the LUMO for the ZnPc molecule is doubly degenerate and that the Q band in the MCD spectrum is mainly associated with the A-term.
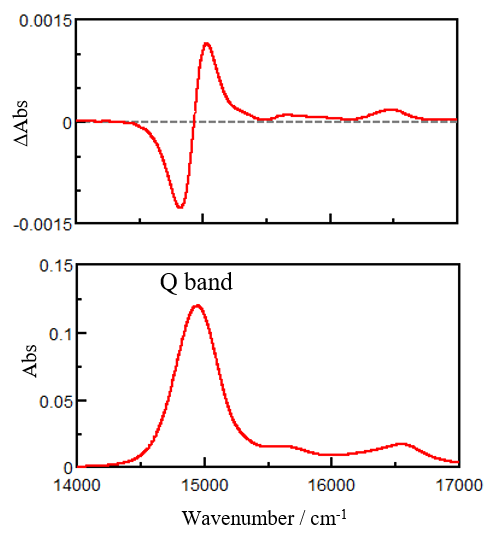
Fig. 5 MCD (top) and absorption (bottom) spectra of ZnPc
Figure 6 shows the HOMO and LUMO energy levels for ZnPc obtained by TD-DFT calculations at the B3LYP/LanL2DZ level of theory, in addition to the Kohn-Sham orbitals for the optimized structure of ZnPc. The HOMO for ZnPc is nondegenerate, whereas the LUMO is doubly degenerate. This confirms that the MCD spectrum, which shows a derivative shape in the Q-band region, is governed by the Faraday A-term.
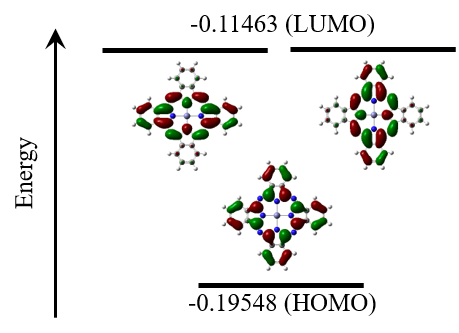
Fig. 6 HOMO and LUMO energy levels and Kohn-Sham orbitals for ZnPc
Based on these results, a band deconvolution analysis of the MCD and absorption spectra was performed, and the results are shown in Figure 7. For the analysis in this report, after decomposing the absorption spectrum into four bands, these bands were assigned to Faraday A– and B-terms for the MCD spectrum. Since the B-term is always present regardless of the symmetry of the molecule, a small B-term was also assigned to the Q band.
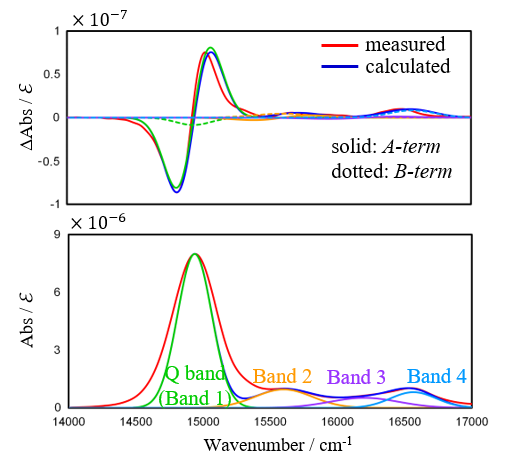
Fig. 7 Band deconvolution results for MCD and absorption spectra of ZnPc
The parameters in equations (1) and (2) are then determined so that the measured and calculated absorption and MCD spectra match. Table 1 shows the Faraday terms together with the ratios A1∕D0 and B0∕D0 for the Q band. The orbital angular momentum for ZnPc was found to be 2.8 from equation (3).
Table 1 Analysis results for Q band for ZnPc
| A1 | B0 | D0 | A1∕D0 | B0∕D0 |
| 15.5 | -0.00772 | 5.45 | 2.8 | -0.0014 |
Thus, MCD spectroscopy allows overlapping bands that cannot be detected using absorption spectroscopy to be distinguished, and allows the properties of molecules to be evaluated by determining their orbital angular momentum, as well as detailed electronic structure analysis.
Conclusion
This report described the analysis of the electronic structure and the determination of the orbital angular momentum by obtaining MCD and absorption spectra for ZnPc and by performing a band deconvolution analysis while taking into account the results of calculations based on the TD-DFT method. MCD spectroscopy is an extremely effective method for evaluating the symmetry of molecules, as it can determine the presence or absence of degeneracy in molecular orbitals in addition to evaluating the electronic structures and magnetic properties of the molecules.
References
1)LA. Andersson: Magnetic Circular Dichroism, Theory. Encyclopedia of Spectroscopy and Spectrometry (Second Edition), 1400-1406 (1999). DOI: 10.1016/B978-0-12-374413-5.00332-8
2)JD. Keegan, AM. Stolzenberg, YC. Lu, RE. Linder, G. Barth, A. Moscowitz, E. Bunnenberg, C. Djerassi: J. Am. Chem. Soc., 104, 4317-4329 (1982). DOI: 10.1021/ja00380a002
3)TC. VanCott, JL. Rose, BE. Williamson, ME. Boyle, GC. Misener, AE. Schrimpf, PN. Schatz: J. Phys. Chem., 93, 2999-3011 (1989). DOI: 10.1021/j100345a028
4)BE. Williamson, TC. VanCott, ME. Boyle, GC. Misener, MJ. Stillman, PN. Schatz: J. Am. Chem. Soc., 114, 2412-2419 (1992). DOI: 10.1021/ja00033a016
5)T. Nyokong, Z. Gasyna, MJ. Stillman: Inorg. Chem., 26, 1087-1095 (1987). DOI: 10.1021/ic00254a025
6)SB. Piepho, PN. Schatz: Group Theory in Spectroscopy with Applications to Magnetic Circular Dichroism, John Wiley & Sons Inc, 1983.
7)PJ. Stephens: J. Chem. Phys., 52, 3489-3516 (1970). DOI: 10.1063/1.1673514
8)TC. VanCott, JL. Rose, BE. Williamson, ME. Boyle, GC. Misener, AE. Schrimpf, PN. Schatz: J. Phys. Chem., 93, 2999-3011 (1989). DOI: 10.1021/j100345a028
9)BE. Williamson, TC. VanCott, ME. Boyle, GC. Misener, MJ. Stillman, PN. Schatz: J. Am. Chem. Soc., 114, 2412-2419 (1992). DOI: 10.1021/ja00033a016
10)K. Kobayashi, K. Nakai: Chem. Commun., 40, 4077-4092 (2007). DOI: 10.1039/b704991a
11)J. Mack, MJ. Stillman, N. Kobayashi: Coord. Chem. Rev., 251, 429-453 (2007). DOI: 10.1016/j.ccr.2006.05.011
This spectroscopy application was developed under the guidance of Professor Naoto Ishikawa, Department of Chemistry, Graduate School of Science, Osaka University.
 spectroscopy")

 Analysis of CBN-Binding DNA Aptamer using CD Spectroscopy")


