Introduction
Diquat is a bipyridinium-type non-selective herbicide that, when in contact with soil, becomes immediately inactive. This feature prevents it from damaging the stem and roots of crops, allowing for immediate planting of seeds or crops after application. However, diquat is highly toxic to humans, and due to its classification as a poisonous substance, a revision to the water quality standards ordinance was announced by the Ministry of Health, Labour and Welfare (Notification No. 101, May 30, 2003). Subsequently, on July 22, 2003, testing methods for diquat were published (Notification No. 261). Additionally, on October 10, 2003, the Ministry introduced water quality management target parameters to complement the water quality standards (Notification No. 1010004).
The analysis method for diquat is outlined in the annex to the “Methods for Testing Water Quality Management Target Parameters” (Notification No. 1010001, October 10, 2003, Final Revision March 24, 2023). Solid-phase extraction (SPE) followed by high-performance liquid chromatography (HPLC) is the adopted method. This analysis method involves concentrating the diquat in the sample water using a solid-phase column, and then eluting it with 0.1 mol/L hydrochloric acid. The sample is then detected based on its optical absorbance in a HPLC system. For water quality testing, the quantification limit must be 1/100th of the target concentration, and the coefficient of variation should be ≤20%. For diquat, the target concentration is set at 0.01 mg/L, with a quantification limit of 0.0001 mg/L (if this limit cannot be achieved, 0.001 mg/L is acceptable).
In this report, we present the results of diquat measurements using this testing method, along with a recovery test using solid-phase extraction.
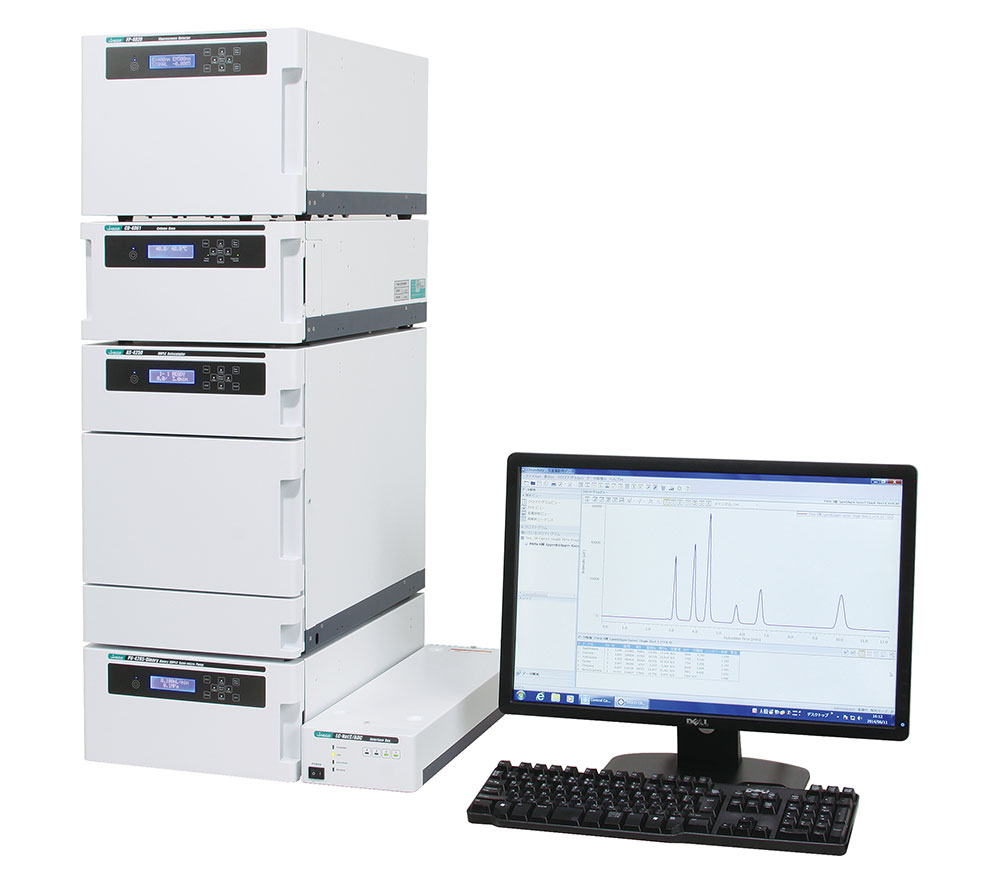
LC-4000 series HPLC system
Experimental
<Instruments>
Pump: PU-4180*
Autosampler: AS-4150*
Column oven: CO-4060
Detector: UV-4075
* with option units
<Conditions>
Column: Inertsil WP 300 C18 (4.6 mmI.D. x 250 mmL, 5 µm)
Eluent : Dissolve 13.5 mL phosphoric acid, 3.0 g, 1-pentanesufonic acid sodium, and 10 mL diethylamine with water and fill up to 1L.
Flow rate: 1.0 mL/min
Column temp.: 40 ºC
Wavelength: 313 nm
Injection volume: 100 µL
<Sample>
Diquat standard stock solution: 19.65 mg diquat dibromide monohydrate standard (Mw 362) dissolved in the mobile phase to make 10 mL (1000 mg/L as diquat (Mw 184)).
Diquat standard solution: A 50-fold dilution of the diquat standard stock solution with the mobile phase (20 mg/L).
Individual standard solutions: Dilutions of the diquat standard solution with 0.1 mol/L hydrochloric acid (concentrations are described in the Results and Discussion section).
<Structure>

Diquat
Keywords
Diquat, water quality standards, Methods for Testing Water Quality Management, Solid-phase extraction, Inertsil WP 300 C18, UV detector
Results
According to the Waterworks Act, the measurement accuracy for pesticides is generally required to be 1/100 of the target concentration. For diquat, the target concentration is set at ≤0.01 mg/L, and the quantification limit is 0.0001 mg/L (if this limit cannot be achieved, the limit is 0.001 mg/L). The samples to be pre-processed are concentrated 100 times using the solid-phase extraction process described later. The target concentration then becomes 1 mg/L, and the quantification limit becomes 0.01 mg/L (if this limit cannot be achieved, the limit is 0.1 mg/L). The calibration curve was prepared by assuming the concentrations after 100 times concentration, and measuring the peak areas for standard solutions at seven concentrations (0.01, 0.02, 0.05, 0.2, 0.5, 2, and 4 mg/L), with each concentration measured three times.
Figure 1-1 shows the chromatogram obtained by measuring the calibration-curve solutions. As shown in Figure 1-2, the calibration curve exhibited good linearity, with a correlation coefficient (r) of ≥ 0.9999.
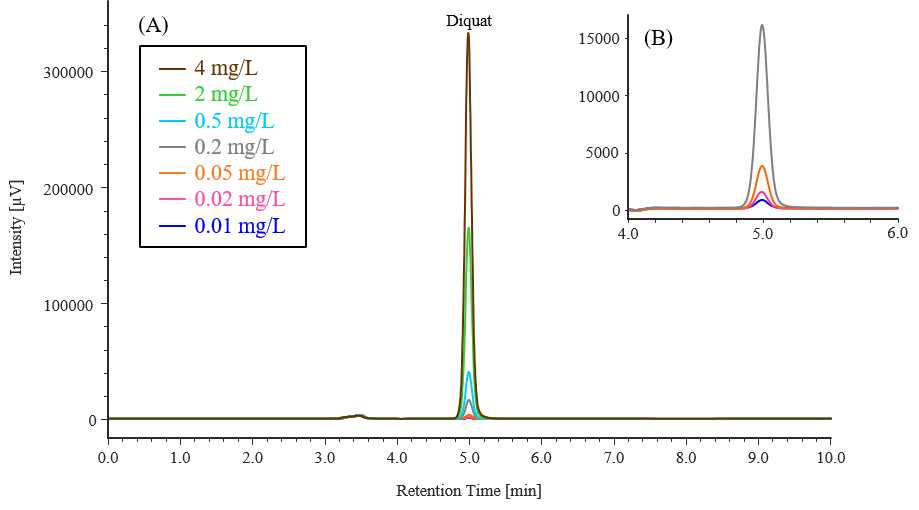
Fig. 1-1 Chromatograms of calibration-curve standard solutions (0.01, 0.02, 0.05, 0.2, 0.5, 2, 4 mg/L)
(A): Full time range, (B): Enlargement of the retention time range of 4-6 min region for low-concentration solutions (0.01, 0.02, 0.05, 0.2 mg/L)
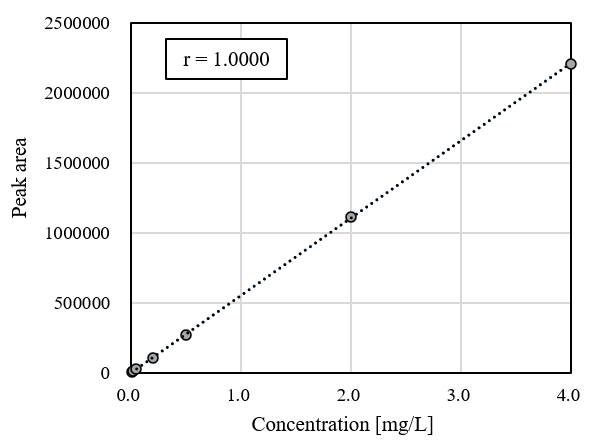
Fig. 1-2 Calibration curve for diquat individual standard solutions (0.01-4 mg/L)
Table 1 shows evaluation results for the validity of the calibration curve. No peaks for diquat were detected in the carryover measurements. Additionally, for all concentrations, the quantitative values fell within 80% to 120% of the prepared concentration, and the relative standard deviation was confirmed to be below 20%
Table 1 Average peak area for each standard solution together with quantitative values
| Concentration [mg/L] | Peak area | Quantitative value [mg/L] | Accuracy [%] | |||||
| #1 | #2 | #3 | Ave. | SD | RSD [%] | |||
| 0.01 | 4387 | 4390 | 4409 | 4395 | 12 | 0.27 | 0.011 | 111 |
| 0.02 | 9839 | 9776 | 9782 | 9799 | 35 | 0.35 | 0.021 | 104 |
| 0.05 | 25161 | 24848 | 24688 | 24899 | 241 | 0.97 | 0.048 | 96.4 |
| 0.2 | 106028 | 105972 | 105942 | 105981 | 44 | 0.04 | 0.195 | 97.5 |
| 0.5 | 271974 | 271744 | 272479 | 272066 | 376 | 0.14 | 0.496 | 99.1 |
| 2 | 1112515 | 1113027 | 1111076 | 1112206 | 1012 | 0.09 | 2.017 | 101 |
| 4 | 2203776 | 2203740 | 2202908 | 2203475 | 491 | 0.02 | 3.992 | 99.8 |
| Blank*1 | N.D.*2 | N.D.*2 | N.D.*2 | |||||
*1 Blank after measurement of high concentration sample (0.1 mol/L hydrochloric acid)
*2 N.D.: not detected
Figures 2-1, 2-2, and 2-3 show chromatograms obtained by repeat measurements of 0.01, 0.1, and 0.5 mg/L standard solutions, and Tables 2-1, 2-2, and 2-3 show the reproducibility of the retention time and the peak area. For all concentrations, good results were obtained, with reproducibilities of ≤0.05 % for retention time and of ≤0.5 % for peak area.
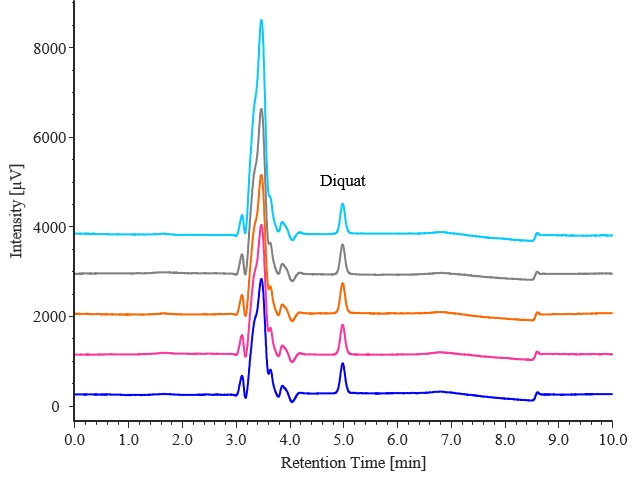
Fig. 2-1 Chromatograms of diquat standard solutions (0.01 mg/L, n = 5)
Table 2-1 Retention time and peak area reproducibility for diquat (0.01 mg/L, n = 5)
| Injection number | Retention time [min] | Peak area |
| 1 | 4.993 | 4415 |
| 2 | 4.993 | 4426 |
| 3 | 4.990 | 4452 |
| 4 | 4.990 | 4424 |
| 5 | 4.993 | 4427 |
| Ave. | 4.992 | 4429 |
| SD | 0.002 | 14 |
| RSD[%] | 0.04 | 0.32 |
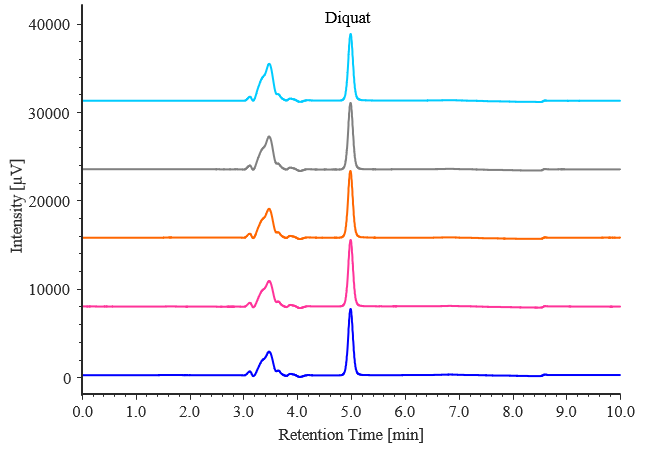
Fig. 2-2 Chromatograms of diquat standard solutions (0.1 mg/L, n = 5)
Table 2-2 Retention time and peak area reproducibility for diquat (0.1 mg/L, n = 5)
| Injection number | Retention time [min] | Peak area |
| 1 | 4.993 | 49517 |
| 2 | 4.993 | 49879 |
| 3 | 4.990 | 49769 |
| 4 | 4.993 | 49871 |
| 5 | 4.993 | 49699 |
| Ave. | 4.993 | 49747 |
| SD | 0.001 | 149 |
| RSD[%] | 0.03 | 0.30 |
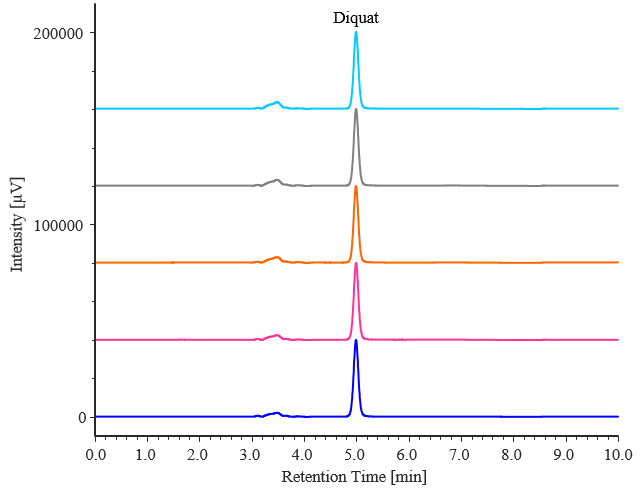
Fig. 2-3 Chromatograms of diquat standard solutions (0.5 mg/L, n = 5)
Table 2-3 Retention time and peak area reproducibility for diquat (0.5 mg/L, n = 5)
| Injection number | Retention time [min] | Peak area |
| 1 | 4.990 | 267148 |
| 2 | 4.993 | 267302 |
| 3 | 4.990 | 267080 |
| 4 | 4.993 | 267447 |
| 5 | 4.993 | 267113 |
| Ave. | 4.992 | 267218 |
| SD | 0.002 | 153 |
| RSD[%] | 0.04 | 0.06 |
Figure 3-1 shows the pretreatment procedure for concentrating samples 100 times using solid-phase extraction. The columns used consisted of silica gel chemically bonded with octadecyl groups, or clomuns with equivalent or superior performance. In this study, we used columns containing Bond Elut C18 (Agilent Technologies) modified with C18 and InertSep CBA (GL Sciences) modified with carboxyl groups, which are weak cation-exchange groups. When the solution containing 0.0001 mg/L of the analyte in purified water was pretreated using column according to the procedure in Figure 3-1, the recovery rate was higher for InertSep CBA, as shown in Table 3-1.
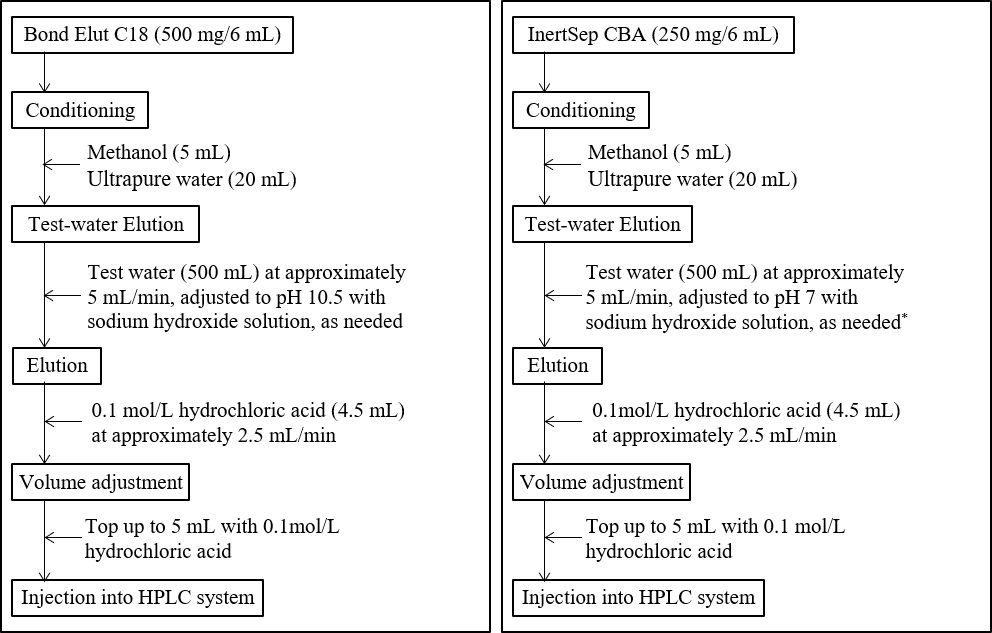
Fig. 3-1 Procedure for concentrating water by solid-phase extraction (100 times concentration)
(A) When using Bond Elut C18, (B) When using InertSep CBA
*By maintaining the pH at around neutral, the diquat is stably retained in the dissociated state of the carboxyl groups, thus preventing elution.
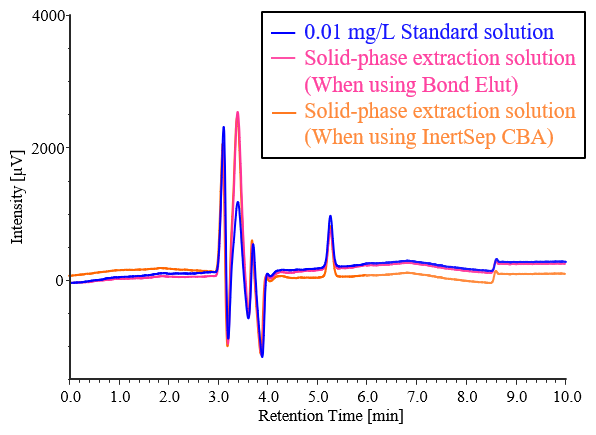
Fig. 3-2 Chromatograms of addition recovery test for 0.0001 mg/L diquat standard solution by solid-phase extraction using ultrapure water
Table 3-1 Results of addition recovery tests for 0.0001 mg/L diquat standard solution by solid-phase extraction using ultrapure water
| Solid-phase extraction columns | Recovery rate [%] |
| Bond Elut C18 | 77.9 |
| InertSep CBA | 99.2 |
Based on the results in Table 3-1, InertSep CBA, which has a high recovery rate, was adopted as the solid-phase extraction column for actual sample measurement. Pretreatment was performed on solutions containing no diquat and solutions containing diquat at concentrations of 0.0001 and 0.001 mg/L using ultrapure water and tap water, and measurements were performed. Figures 3-3 and 3-4 show the chromatograms obtained from the addition recovery tests for ultrapure water and tap water using solid-phase extraction, and Tables 3-2 and 3-3 show the peak areas and recovery rates for each sample. In ultrapure water and tap water without added diquat, no diquat peaks were detected. All samples with added diquat achieved excellent recovery rates of over 90%, confirming that they meet the 70–130% standard required by the Waterworks Act.
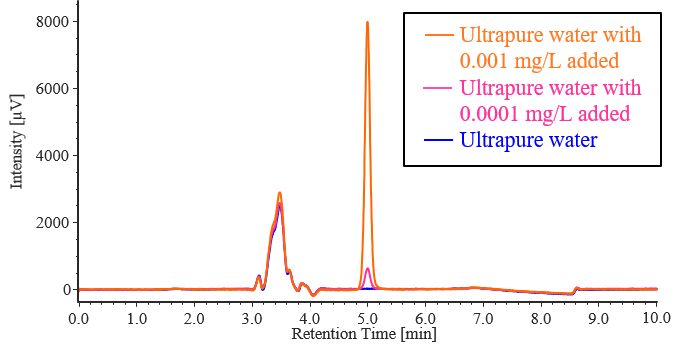
Fig. 3-3 Chromatograms obtained in addition-recovery tests for diquat standard solution by solid-phase extraction using ultrapure water
Table 3-2 Results of addition-recovery tests for diquat standard solutions using solid-phase extraction with ultrapure water
| Sample | Peak area | Recovery rate [%] |
| Ultrapure water | N.D.* | – |
| Ultrapure water with 0.0001 mg/L added | 4134 | 94.4 |
| Ultrapure water with 0.001 mg/L added | 52489 | 108 |
*N.D.: not detected
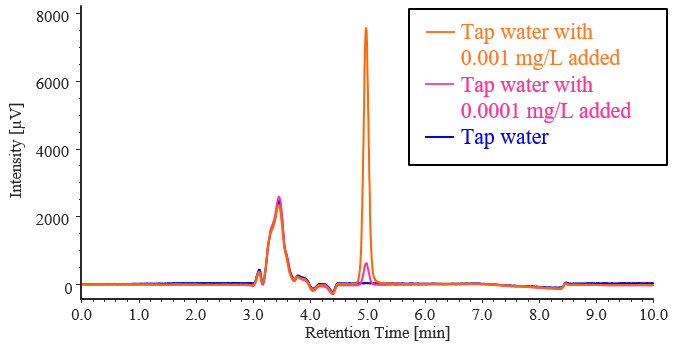
Fig. 3-4 Chromatograms obtained in addition-recovery test for diquat standard solution by solid-phase extraction using tap water
Table 3-3 Results of addition-recovery tests for diquat standard solutions using solid-phase extraction with tap water
| Sample | Peak area | Recovery rate [%] |
| Tap water | N.D.* | – |
| Tap water with 0.0001 mg/L added | 4299 | 98.2 |
| Tap water with 0.001 mg/L added | 49756 | 102 |
*N.D.: not detected
Conclusion
Measurements of diquat concentration using the solid-phase extraction-HPLC method based on the water quality management target parameters, showed that concentrations as low as 0.0001 mg/L can be detected, which is equivalent to 1/100th of the target concentration required by the Water Supply Law.
A calibration curve was produced by measuring seven concentrations of 0.01, 0.02, 0.05, 0.2, 0.5, 2, and 4 mg/L, assuming a 100-fold concentration increase after solid-phase extraction, and it was confirmed that the method ensures good linearity and validity. In a spiked recovery test, ultra-pure water and tap water were pretreated by adding diquat to achieve concentrations of 0.001 and 0.0001 mg/L, respectively. Both showed excellent recovery rates of over 90%, confirming that they meet the 70–130% standard required by the Waterworks Act.
References
Ministry of the Environment, Water and Air Environment Bureau, Environmental Management Division.
“Testing Methods for Items with Target Values for Water Quality Management (Last revised: March 26, 2025).”
<https://www.env.go.jp/content/900547462.pdf> (accessed September 8, 2025).
Ministry of the Environment, Water Quality and Sanitation Management Office National Institute of Health Sciences “Guidelines for Validation of Drinking Water Quality Testing Methods (Last revised: October 18, 2017).”
<https://www.env.go.jp/content/900546879.pdf> (accessed September 8, 2025).


