Introduction
The evaluation of materials used in optical communication devices often requires high sensitivity measurements in the near infrared region. The optical elements that are used, such as band pass and cut-off filters, are designed to preferentially select the wavelengths that are used for the communication signal and reject the wavelengths that contribute noise. The filters must be designed so that the maximum signal amplitude is obtained after passing through the optical element.
This article demonstrates the high sensitivity measurement of optical elements using UV-Vis/NIR spectrophotometer with an InGaAs detector.
UV-Vis/NIR Spectrophotometer (V-780)
Experimental
Comparison with PbS Detector
Figure 1 shows the results for a 1.3 µm band frequency cut-off filter used for optical communications. The spectra were obtained using two different UV-visible/NIR spectrophotometers; one using a PbS detector and the other using an InGaAs detector. As seen in Figure 1, the spectra obtained with the InGaAs detector shows a much higher S/N than those with a PbS detector.
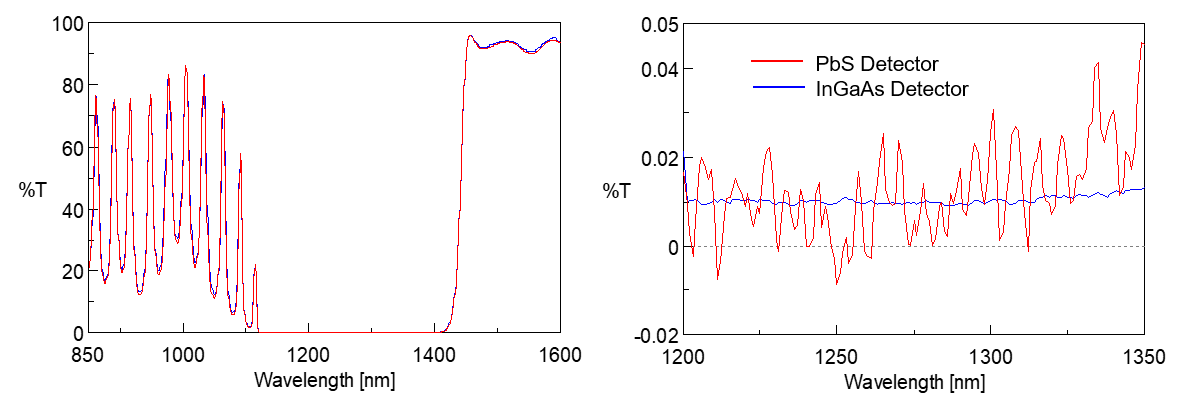
Figure 1. Transmission spectra of 1.3 µm band frequency cut filter
<Measurement Condition>
Wavelength range: 1600 – 850 nm
Bandwidth: 4.0 nm
Response: Medium
Data interval: 1 nm
Scan speed: 200 nm/min
High-resolution measurement
Figure 2 shows the results of a 1050 nm laser cut filter at varying spectral bandwidths. Small bandwidths enable high-resolution visualization of the edge of the cut-off filter, as well as the interference curve of a multi-layer filter. Both characteristics are not observed at larger bandwidths and at the smallest bandwidth – 0.2 nm, good S/N is still maintained.
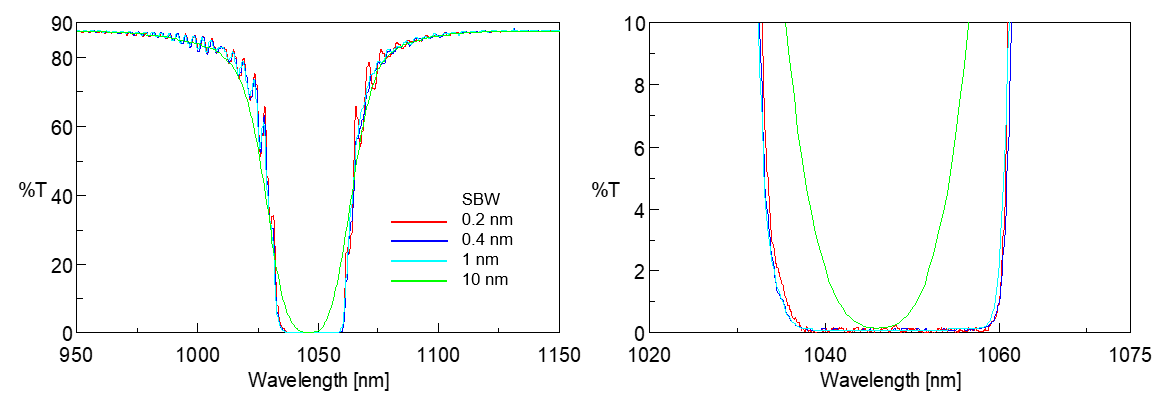
Figure 2. Transmission spectra of 1050 nm laser cut filter
<Measurement Condition>
| Wavelength range | 1150 – 950 nm | |||
| Response | Slow | |||
| Band width [nm] | 0.2 | 0.4 | 1.0 | 10 |
| Scan speed [nm/min] | 10 | 10 | 20 | 200 |
| Data interval [nm] | 0.05 | 0.1 | 0.2 | 0.5 |
High-scan speed measurement
Figure 3 shows the results of a 1.3 µm band frequency cut-off filter at varying scan speeds. The data indicate that even at the maximum scan speed of 400 nm/min, good S/N and spectral shape are well maintained.
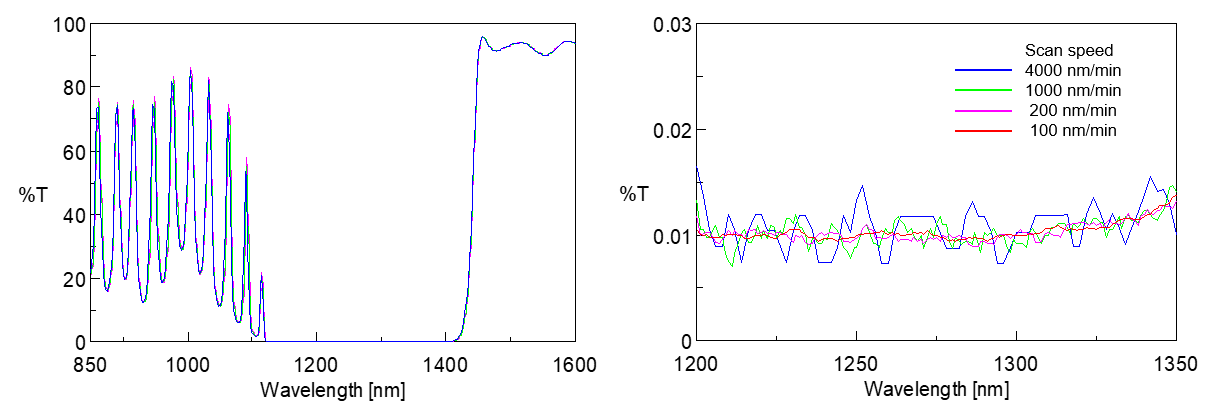
Figure 3. Transmission spectra of 1.3 µm band frequency cut filter
<Measurement Condition>
| Wavelength range | 1600 – 850 nm | |||
| Band width | 4.0 nm | |||
| Scan speed [nm/min] | 4000 | 1000 | 200 | 100 |
| Response | Quick | Fast | Medium | Slow |
| Data interval [nm] | 2 | 1 | 1 | 1 |
Variable angle measurement using Integrating sphere
The absolute reflectance measurement system with an integrating sphere was used to measure a 1050 nm laser cut-off filter. Figure 4 shows the measurements at varying incident angles with a spectral a bandwidth of 1 nm. While integrating spheres are known to decrease sensitivity, the use of the InGaAs detector with the integrating sphere enables high S/N and resolution.
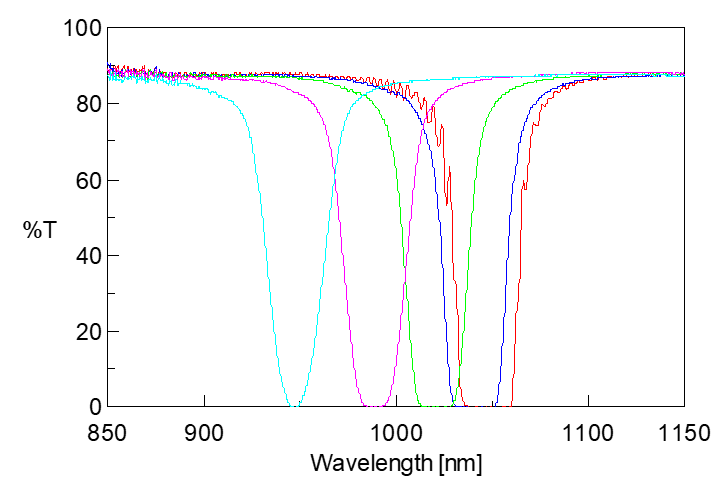
Figure 4. Transmission spectra of 1050 nm Laser cut filter
<Measurement Condition>
Incident angle: 0, 10, 20, 30, 40 degrees
Wavelength range: 1150 – 950 nm
Data interval: 0.2 nm
NIR bandwidth: 1.0 nm
Response: Fast
Scan speed: 200 nm/min
Related Posts:
 Evaluation of Reflectance of Microlens Surface using…
 Orthogonal Assessment of Polymer Materials Including…
 Combined Analysis of Thermochromic Materials -FT-IR…
 Vibrational Circular Dichroism Spectrometer based on…
 Highly efficient spectral measurement methods using…
 Optical Rotation Measurement for High-concentration…