
Introduction
Cyanide is rarely found naturally in water. However, cyanide ions (CN–) may be introduced through contamination from wastewater and other sources. In addition, cyanogen chloride (CNCl) can be formed during the chlorination of water. These substances are regulated due to their potential impact on the safety of tap water and are designated as water quality standard items under the Water Supply Act (Ministry of Health, Labour and Welfare Ordinance No. 101). Post-column ion chromatography is the adopted analytical method. This approach follows the procedure established under the Ministerial Ordinance on Water Quality Standards (Ministry of Health, Labour and Welfare Notification No. 261, Final Revision; Ministry of the Environment Notification No. 25, March 26, 2025). In the 2025 revision, ethyl alcohol was introduced as a less toxic solvent for the color developer in addition to the previously used N, N-dimethylformamide (DMF), improving the safety of the testing environment. In this method, CN– eluted from the column first reacts with chloramine-T to form CNCl, which subsequently reacts with a 4-pyridinecarboxylic acid/pyrazolone solution to produce a blue-colored substance. Detection is performed at a wavelength of 636 nm, allowing separate quantification of CN– and CNCl. For water quality testing, sufficient precision is required to ensure that measurement variations should be ≤10 % at concentrations around 1/10th of the standard value.
For this measurement, the RSpak KC-811 6E column for cyanide analysis was used. The validity of the calibration curves for CN– and CNCl was evaluated according to the “Validity Assessment Guidelines” (Attachment to Health and Water Notice No. 0906-1 September 6, 2012, Final Revision; Pharmaceutical and Food Safety Bureau Notice No. 1018-1 October 18, 2017).
Experimental
Instruments
Eluent pump: PU-4180*
Reaction pump1: PU-4185
Reaction pump2: PU-4185
Autosampler: AS-4050*
Column oven: CO-4060
Reaction oven: RO-4068
Detector: UV-4070
*with option units
Conditions
Column: RSpak KC-811 6E (6.0 mmI.D. x 250 mmL, 6 µm)
Guard column: RSpak KC-G 6B (6.0 mmI.D. x 50 mmL)
Eluent: 1 mmol/L sulfuric acid aqueous solution
Reagent 1: 0.1 mol/L phosphate buffer solution containing 0.1 % (w/v) chloramine-T
Reagent 2: 23 mmol/L 1-phenyl-3-methyl-5-pyrazolone, 77 mmol/L sodium 4-pyridinecarboxylate, aqueous solution containing 30 % ethanol
Eluent flow rate: 1.0 mL/min
Reagent1 flow rate: 0.5 mL/min
Reagent2 flow rate: 0.4 mL/min
Column temperature: 40 ºC
Reaction temperature: 100 ºC
Wavelength: 636 nm
Injection volume: 100 µL
Standard sample: Mixed standard solution of CN- and CNCl
Flow diagram
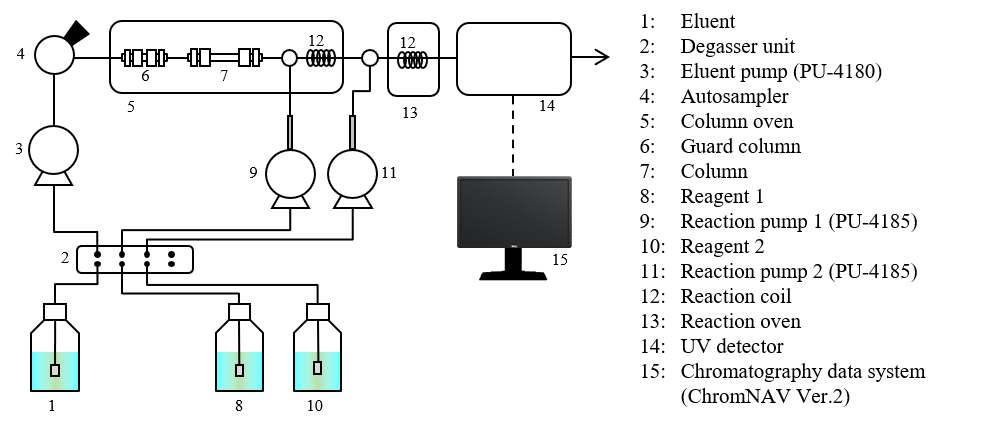
Reaction pathways for cyanide, chloramine-T, and 4-pyridinecarboxylic acid

Keywords
Cyanide, Cyanide ions, Cyanogen chloride, Ethyl alcohol, Water quality standards, Post-column derivatization, RSpak KC-811 6E, Validation guidelines, UV-visible spectrophotometer
Results
According to the Waterworks Act, the measurement accuracy for CN– and CNCl is generally required to be 1/10th of the target concentration, which is set at ≤10 µg/L, and the quantification limit is 1.0 µg/L. A calibration curve was prepared by measuring the peak areas for mixed standard solutions at five different concentrations (0.5, 1.0, 2.0, 5.0, and 10 µg/L), with each solution measured three times.
Figure 1 shows the chromatogram obtained by measuring mixed calibration solutions of CN– and CNCl. Figure 2 shows the calibration curve, which exhibits good linearity, with a correlation coefficient (r) of ≥ 0.9992.
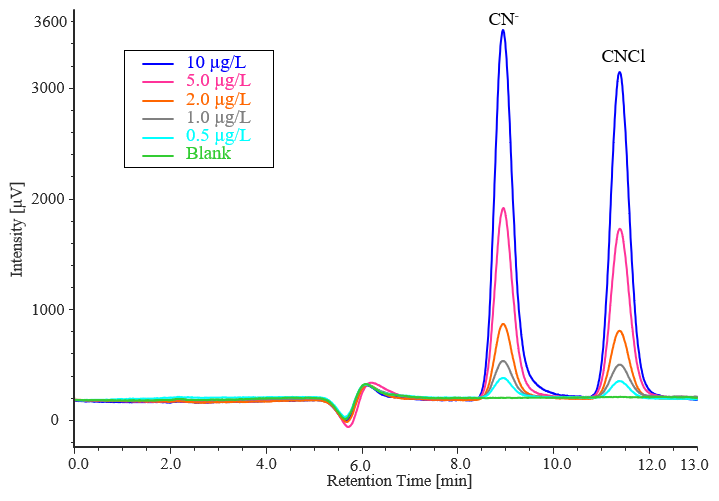
Fig. 1 Chromatograms for mixed standard solutions of CN– and CNCl (0.5, 1.0, 2.0, 5.0, 10 µg/L)
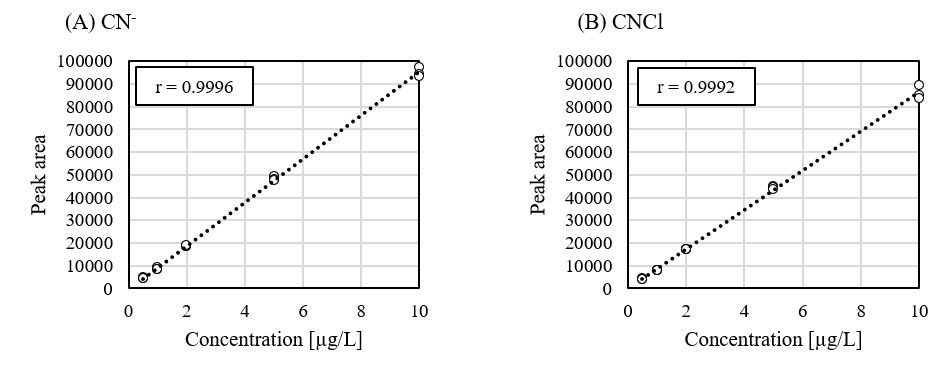
Fig. 2 Calibration curves for mixed standard solutions of (A) CN– and (B) CNCl
Tables 1 and 2 show the results of evaluating the validity of the calibration curves. No peaks for CN– or CNCl were detected in the carryover measurements. Additionally, for all concentrations, the quantitative values fell within 94-104 % of the prepared concentration, and the relative standard deviation was confirmed to be below 4.2 %.
Table 1 Validity of calibration curve for CN–
| Concentration [µg/L] | Peak area | Quantitative value [µg/L] | Accuracy [%] | |||||
| #1 | #2 | #3 | Ave. | SD | RSD [%] | |||
| 0.5 | 4696 | 4487 | 4375 | 4519 | 163 | 3.61 | 0.52 | 103.7 |
| 1.0 | 9041 | 8354 | 8502 | 8632 | 362 | 4.19 | 0.95 | 94.8 |
| 2.0 | 18382 | 18242 | 19086 | 18570 | 452 | 2.44 | 1.99 | 99.3 |
| 5.0 | 49146 | 48066 | 47421 | 48211 | 872 | 1.81 | 5.08 | 101.6 |
| 10.0 | 97352 | 94181 | 93444 | 94992 | 2076 | 2.19 | 9.97 | 99.7 |
| Blank*1 | N.D.*2 | N.D.*2 | N.D.*2 | |||||
*1 Blank after measurement of high-concentration sample (Ultrapure water)
*2 N.D.: not detected
Table 2 Validity of calibration curve for CNCl
| Concentration [µg/L] | Peak area | Quantitative value [µg/L] | Accuracy [%] | |||||
| #1 | #2 | #3 | Ave. | SD | RSD [%] | |||
| 0.5 | 4149 | 4080 | 4068 | 4099 | 44 | 1.07 | 0.49 | 98.6 |
| 1.0 | 8061 | 7891 | 7972 | 7975 | 85 | 1.07 | 0.94 | 94.1 |
| 2.0 | 17183 | 17110 | 17133 | 17142 | 37 | 0.22 | 2.00 | 100.0 |
| 5.0 | 44903 | 44267 | 43341 | 44170 | 785 | 1.78 | 5.12 | 102.4 |
| 10.0 | 89196 | 84825 | 83779 | 85933 | 2874 | 3.34 | 9.95 | 99.5 |
| Blank*1 | N.D.*2 | N.D.*2 | N.D.*2 | |||||
Table 3 shows the repeatability of the peak area, quantitative value and accuracy obtained by repeat measurements of a 0.5 µg/L mixed standard solution. In all cases, the peak area and quantitative values demonstrated a good repeatability of 4.6 % or less, and the accuracy was confirmed to fell within 98-112 %.
Table 3 Repeatability of CN– and CNCl (n = 6)
| Peak area | Quantitative value [µg/L] | Accuracy [%] | ||||
| # | CN– | CNCl | CN– | CNCl | CN– | CNCl |
| 1 | 4537 | 4112 | 0.52 | 0.49 | 104.1 | 98.9 |
| 2 | 4496 | 4266 | 0.52 | 0.51 | 103.2 | 102.4 |
| 3 | 4709 | 4651 | 0.54 | 0.56 | 107.7 | 111.3 |
| 4 | 4298 | 4220 | 0.50 | 0.51 | 99.1 | 101.4 |
| 5 | 4423 | 4175 | 0.51 | 0.50 | 101.7 | 100.3 |
| 6 | 4606 | 4208 | 0.53 | 0.51 | 105.5 | 101.1 |
| Ave. | 4512 | 4272 | 0.52 | 0.51 | 103.5 | 102.6 |
| SD | 143.0 | 192.6 | 0.01 | 0.02 | 2.99 | 4.45 |
| RSD [%] | 3.17 | 4.51 | 2.88 | 4.34 | 2.88 | 4.34 |
Conclusion
This application note investigated the measurement of CN– and CNCl using post-column ion chromatography based on the water quality standards using ethyl alcohol as the solvent for the color developer instead of the conventionally used N, N-dimethylformamide. The results showed that CN– and CNCl could be detected down to 0.001 mg/L, equivalent to 1/10th of the standard value required by the Water Supply Act. Calibration curves were measured at 0.5, 1.0, 2.0, 5.0, and 10 µg/L using mixed standard solutions, confirming good linearity and validity.
Related Posts:
 Analysis of Amino Acids by On-line Pre-column…
 Analysis of Styrofoam by GPC/SEC using mixed gel column
 Analysis of Anionic Surfactants using C8 Column
 Analysis of Anionic Surfactants Using Carbon-Chain…
 Analysis of Anionic Surfactants Using Carbon-Chain…
 Analysis of Glyphosate and Aminomethyl Phosphonic…