Introduction
Anionic surfactants are active ingredients in synthetic detergents and their analysis is one of the water-quality test items specified in Japan’s Water Supply Act, as they are indicators of pollution caused by contamination from factory effluents and domestic wastewater. High-performance liquid chromatography (HPLC) combined with fluorescence detection is used to measure levels of anionic surfactants in water (Notification No. 261 of the Ministry of Health, Labour and Welfare, 2003, Appendix 24). In this method, sodium alkylbenzenesulphonate (ABS), with carbon atoms in the alkyl chain at numbers between 10 and 14, is the target of the measurement, with a standard value of 0.2 mg/L for the sum of the five components. When carrying out water quality testing, it is necessary to measure down to a concentration of 1/10th of the standard value and to ensure that the measurement precision at this concentration is less than 20 %.
A typical C18 column (modified group: octadecyl group) can distinguish the branched state of carbon chains so that ABS molecules with an identical number of carbon atoms are separated based on their branching state and produce multiple peaks. In this application note, we report the separation of anion surfactants using a Unifinepak C18 column, which distinguish between branching states together with highly sensitive analysis, which distinguish between branching states but instead produces a different elution peak depending on the number of carbon atoms in the chain, together with highly sensitive analysis using a fluorescence detector. In addition, we report the results of a recovery test based on the Water Supply Act using solid-phase extraction.
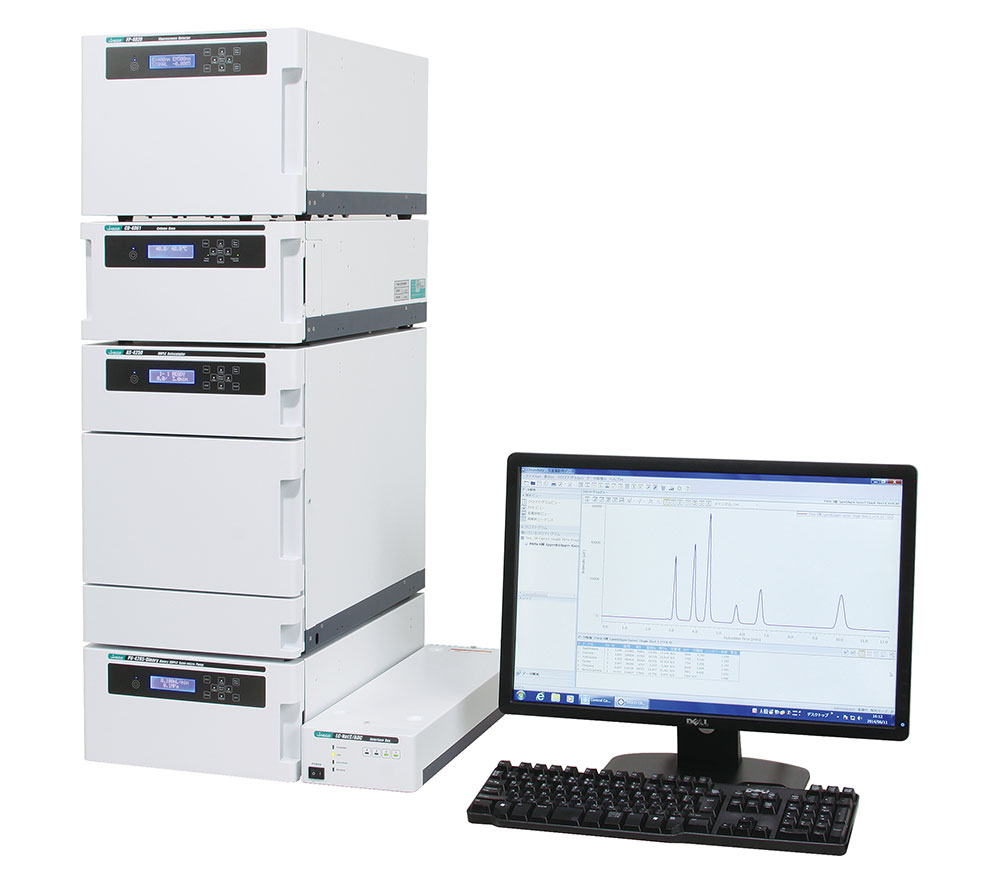
LC-4000 series HPLC system
Experimental
Instruments
Pump: PU-4180*
Autosampler: AS-4050
Column oven: CO-4060
Detector: FP-4025
*with option units
Conditions
Column: Unifinepak C18 (4.6 mmI.D. x 250 mmL, 5 µm)
Eluent: 0.1 mmol/L sodium perchlorate in acetonitrile/ultrapure water (65/35)
Flow rate: 1.0 mL/min
Column temp.: 40 ºC
Wavelength: Ex. 221 nm, Em. 284 nm, Gain x 10
Inj. volume: 10 µL
Standard samples : Mixed standard solutions of anionic surfactants in methanol (1.0, 2.0, 5.0, 10, 25 mg/mL each)
Structure

Keywords
Anionic surfactant, Sodium alkylbenzenesulfonate, Water quality standards, Unifinepak C18, Solid-phase extraction, Fluorescence detector
Results
Since samples used for water testing are first concentrated 250-fold by solid-phase extraction, the calibration curve range reflects their concentration following this step. Table 1 shows the concentrations of each component calculated from the standard value and that following condensation by solid-phase extraction. In this experiment, the minimum and maximum concentrations of each component were set at 1 mg/L and 25 mg/L, respectively, and calibration curves were created by performing three repeat measurements at five different concentrations. The results exhibit good linearity, with a correlation coefficient (r) of ≥ 0.9997 for all components.
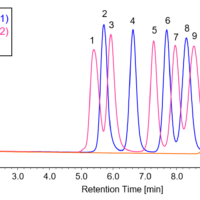
Figure 1 shows chromatograms for mixed standard solutions of anionic surfactants at each concentration, measured for the third time. Figure 2 shows the chromatograms for blanks (methanol) measured immediately after measuring a standard sample with the maximum concentration. The results confirm that no carryover above the minimum concentration in the calibration curve occurs.
Table 1 Concentration range for calibration curve calculated from standard values for five anionic surfactant components
| Concentration at sampling [mg/L] | Concentration after 250 times condensation [mg/L] | ||
| Standard value | Sum of 5 components | 0.2 | 50 |
| 1 component | 0.04 | 10 | |
| 1/10th of standard value | Sum of 5 components | 0.02 | 5.0 |
| 1 component | 0.004 | 1.0 | |
| Calibration range | Sum of 5 components | 0.02-0.5 | 5.0-125 |
| 1 component | 0.004-0.1 | 1.0-25 | |
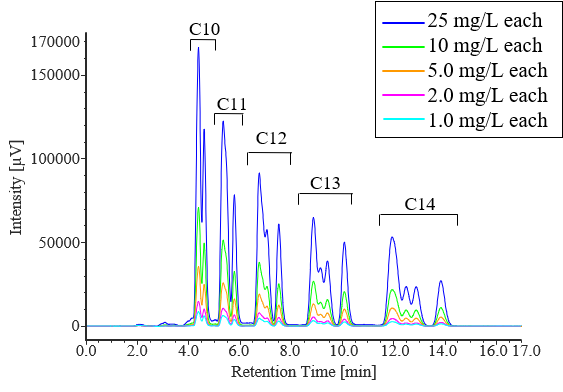
Fig. 1 Chromatograms for mixed standard solutions of anionic surfactants in methanol, measured for the third time.
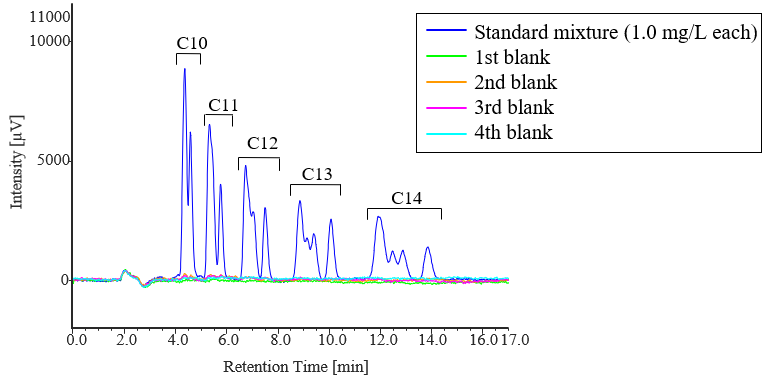
Fig. 2 Blank chromatograms for carryover check (chromatogram for standard mixture with 1.0 mg/L each is overlaid)
Table 2 shows the quantification results for the standard mixture of anionic surfactants at each concentration based on the calibration curves, and the calculated accuracy of the observed values relative to the theoretical concentrations. For all components and concentrations, the accuracy was found to be 93-107 % of the theoretical concentration, satisfying the 80-120 % range specified in the Water Supply Act.
Figure 3 shows the results of five repeat measurements of a standard sample with a concentration of 1/10th of the standard value. The repeatability of the measured peak area for each component is shown in Table 3. The results confirm that the repeatability (RSD) is less than 2.5 % for all components.
Table 2 Accuracy of measured concentrations relative to theoretical values for mixed standard solutions of anionic surfactants
| Theoretical concentration [mg/L] | Accuracy [%]* | ||||
| C10 | C11 | C12 | C13 | C14 | |
| 1.0 | 97 | 106 | 107 | 105 | 107 |
| 2.0 | 93 | 95 | 96 | 95 | 94 |
| 5.0 | 100 | 100 | 100 | 99 | 100 |
| 10 | 102 | 100 | 100 | 101 | 101 |
| 25 | 100 | 100 | 100 | 100 | 100 |
* The average of the quantitative values obtained by repeat measurements (n = 3) is used for the calculation.
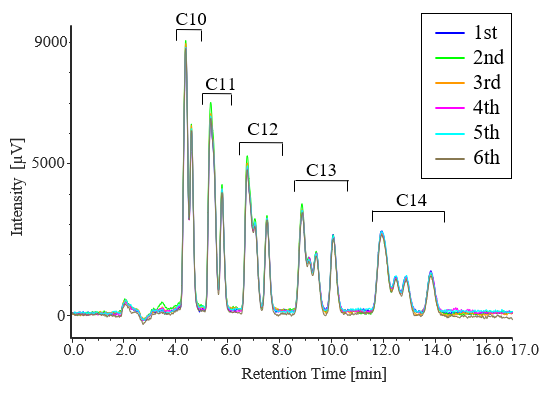
Fig. 3 Chromatograms for repeat measurements of mixed standard solutions of anionic surfactants (1.0 mg/L each, n = 6)
Table 3 Repeatability of mixed standard solutions of anionic surfactants (1.0 mg/L each, n = 6)
| Number of injections | Peak area [µV・s] | ||||
| C10 | C11 | C12 | C13 | C14 | |
| 1 | 151658 | 150705 | 147763 | 142778 | 139890 |
| 2 | 154083 | 157963 | 152240 | 146322 | 136257 |
| 3 | 153244 | 152385 | 150013 | 143154 | 137680 |
| 4 | 150115 | 147668 | 146679 | 140704 | 135557 |
| 5 | 147292 | 150438 | 147776 | 141121 | 135788 |
| 6 | 150906 | 148284 | 150030 | 146757 | 136681 |
| Average | 151216 | 151241 | 149084 | 143473 | 136976 |
| SD | 2418 | 3713 | 2047 | 2557 | 1613 |
| RSD [%] | 1.60 | 2.46 | 1.37 | 1.78 | 1.18 |
Figure 4 shows the pretreatment procedure for concentrating samples 250-fold using solid-phase extraction. The column used was as specified in the Water Supply Act, namely silica gel chemically bonded with octadecyl groups or a column with equivalent or superior performance. In this application note, we used an InertSep* C18-ENV column modified with C18. Tap water containing 0.004 mg/L of five anionic surfactant standards was pretreated according to the procedure shown in Figure 4.
* InertSep is a trademark or registered mark of GL Sciences Inc.
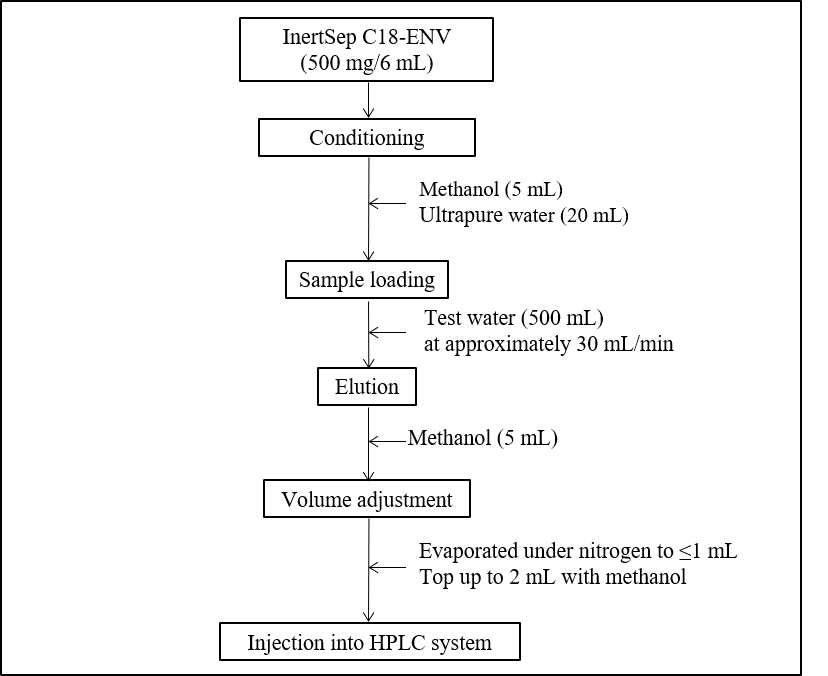
Fig. 4 Procedure for concentrating water by solid-phase extraction (250-fold concentration)
Pretreatment was performed on tap water containing five anionic surfactant standards at concentrations of 0.004 mg/L, and measurements were performed. Figure 5 shows chromatograms of the spiked recovery test using an InertSep C18-ENV solid-phase extraction column. Table 4 shows that each component achieved an excellent recovery rates of over 76 %, confirming that they meet the 70–130 % standard required by the Water Supply Act.
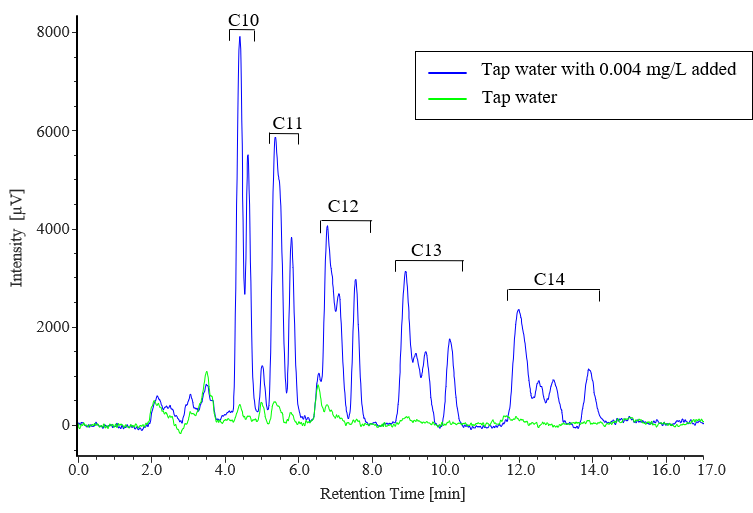
Fig. 5 Chromatograms for spiked recovery test of five anionic surfactant standards by solid-phase extraction
Table 4 Results of spiked recovery test for five anionic surfactant standards by solid-phase extraction
| Sample | Recovery rate [%] | ||||
| C10 | C11 | C12 | C13 | C14 | |
| Tap water | – | – | – | – | – |
| Tap water with 0.004 mg/L added | 76 | 92 | 94 | 80 | 83 |
Conclusion
Measurements of anionic surfactants using a carbon-chain branch-sensitive column showed that the measurement precision could be maintained at ≤20 % at concentrations of 1/10th of the target concentration specified in the Water Supply Act’s water quality standards. A calibration curve was produced by measuring five concentrations of 1.0, 2.0, 5.0, 10 and 25 mg/L, assuming a 250-fold concentration increase after solid-phase extraction, and it was confirmed that the method ensures good linearity and validity.
In a spiked recovery test, tap water was pretreated by adding a mixed standard solution of anionic surfactants to achieve concentrations of 0.004 mg/L each. The result showed excellent recovery rates of over 76 %, confirming that they meet the 70–130 % standard required by the Water Supply Act.