Introduction
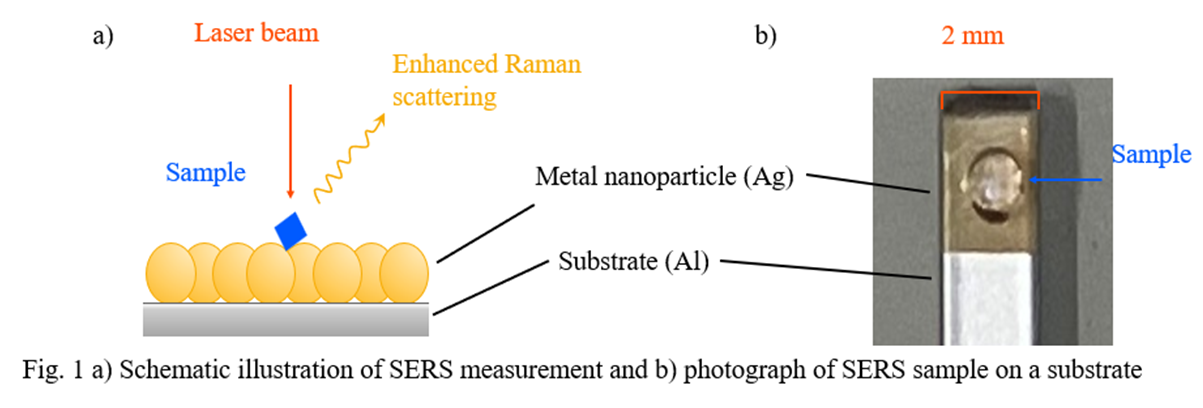
Surface-Enhanced Raman Scattering (SERS) is a phenomenon in which the Raman scattering intensity is significantly enhanced by the presence of molecules adsorbed on the surface of metal nanoparticles such as gold and silver (Fig. 1a).1) Raman spectroscopy is widely used for qualitative analysis of samples in gaseous, liquid or solid state. However, since this method often requires the detection of extremely weak scattered light, lack of sensitivity can be an issue, particularly for measurements of low-concentration solutions. In contrast, unlike conventional Raman spectroscopy, SERS has the potential to detect trace constituents and analyze the vibrational modes of specific molecules with high sensitivity.2) In the present study, three energy drinks (A, B and C) containing trace amounts of vitamins (several mol/m3), which are difficult to detect by conventional Raman spectroscopy (non-SERS conditions), were measured. The measurements were performed under both non-SERS and SERS conditions, and the results were compared. For the SERS measurements, a SERS substrate with metal nanoparticles coated on its surface was used (Fig. 1b).
Experimental
[Sample] One drop (a few µL) of three commercial energy drinks (A, B and C) on each substrate
[Instrument] NRS-5500 Raman spectrometer
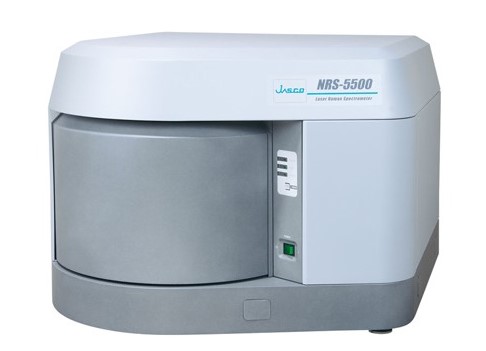
Fig.2 NRS-5500 Raman spectrometer
[Parameters]
1. Non-SERS conditions
Substrate : Liquid/powder holder (8 holes), Laser wavelength : 532 nm Laser power: 10.9 mW
2. SERS conditions
Substrate : Nano=Kraft AluSERS (ANVOS Analytics) 3)
Laser wavelength : 785 nm, Laser power: 0.1 mW (sample A), 1.1 mW (sample B, C)
– The optimum values for each sample were set for other parameters.
– Non-SERS measurements were performed at the standard excitation wavelength of 532 nm. For the SERS measurements, the appropriate excitation wavelength and laser intensity were chosen based on the SERS substrate used.
Keywords
< Keywords > SERS, Surface enhanced Raman scattering, Resonance Raman spectroscopy, Food, Raman spectrometer < Key Points > Highly sensitive detection of trace constituents is possible.
Results
Non-SERS conditions
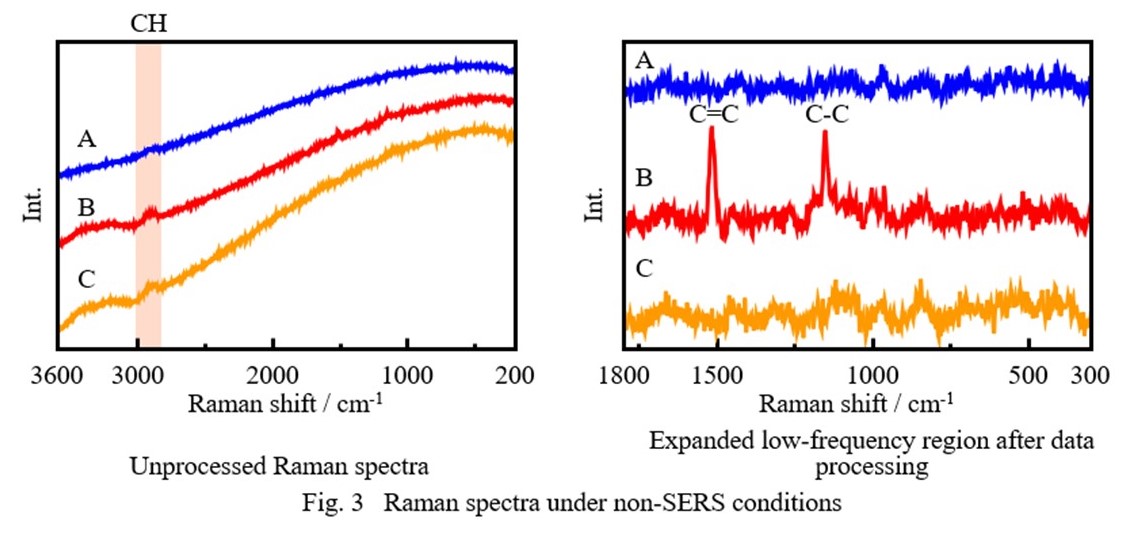
Figure 3 shows Raman spectra measured under non-SERS conditions. For all three samples, a band attributed to CH groups is seen in the range of 2800 to 3000 cm-1, confirming the presence of organic compounds. For sample B only, additional bands appear at 1518 cm-1 and 1155 cm-1. These may be associated with enhancement of the Raman signals due to C=C and C-C bonds4) in the β-carotene pigment, which is present only in sample B, as a result of resonance Raman scattering.a) However, it was difficult to clearly distinguish among the three samples from these results alone.
SERS conditions
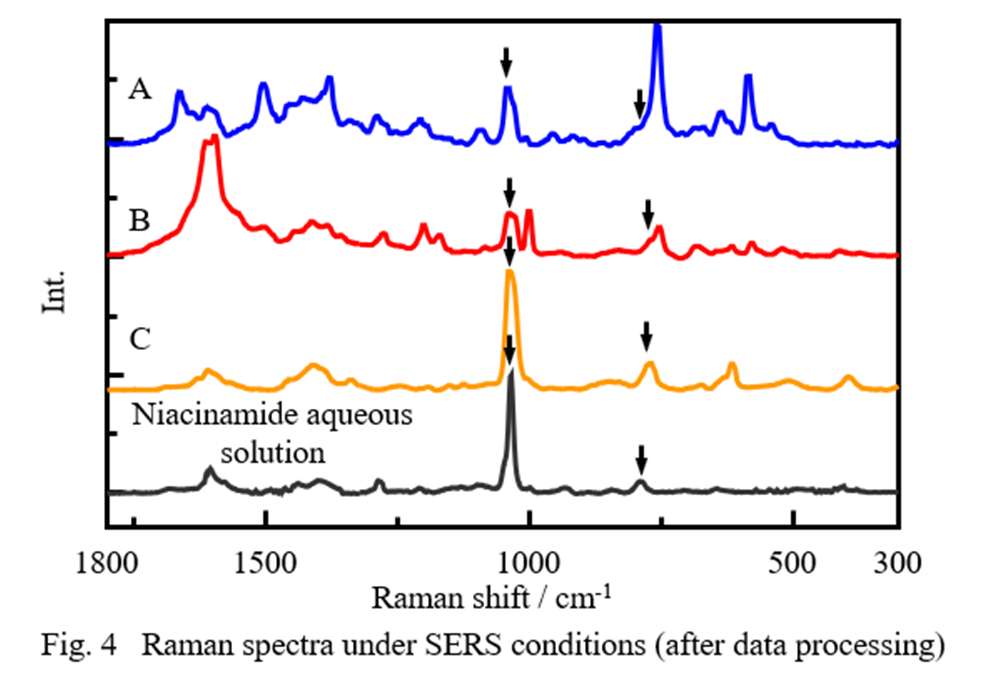
The spectra obtained for samples A, B and C using the SERS substrate are shown in Fig. 4, together with that for an aqueous solution of niacinamide (black line), which is a common constituent of all four samples. It can be seen that similar bands are present at around 1040 cm-1 and 780 cm-1 (indicated by arrows) in all of the spectra. In addition, different features are observed at around 1600 cm-1 and 1000 cm-1, which are attributed to aromatic and pyridine rings, and in the low-wavenumber region below 600 cm-1, making it possible to distinguish among the samples.
The niacinamide concentration in these samples was very low (<1.6 mol/m3), even in the most concentrated samples. These results therefore indicate that SERS can be used to measure low-concentration components with high sensitivity, which are difficult to detect under non-SERS conditions.
Conclusion
The use of SERS allowed highly sensitive detection of niacinamide and other trace constituents of energy drinks at concentrations below a few mol/m³. The measurements could be carried out using a simple procedure involving only a single drop of sample on a substrate.
SERS measurements are expected to allow simple and sensitive analysis of chemical structures with sample volumes of only a few µL in fields such as pharmaceuticals, food safety and environmental monitoring.
< References >
- H. Hamaguchi, K Iwata (Eds): “Raman Spectroscopy”, P.23 (2015), KODANSHA SCIENTIFIC LTD.
- Technical Information Institute Co. Ltd.: “Case Studies of Raman Spectroscopy Data Analysis”, 1st edition,pp. 53-60, 334-339 (2022),TECHNICAL INFORMATION INSTITUTE CO. LTD
- ANVOS Analytics HP: <https://anvos-analytics.com/>, (accessed 2025. 7. 7).
- L. Lu, L. Shi, J. Secor, R. Alfano: J. Photochem. Photobiol., B, 179, 18 (2017).
DOI: 10.1016/j.jphotobiol.2017.12.022
< Acknowledgements >
This work was performed under the guidance of Professor Hiroyuki Takei, Faculty of Life Sciences, Toyo University. I would like to take this opportunity to express my deep gratitude.
Related Posts:
 Reaction Monitoring System using Surface-Enhanced…
 Resonance Raman Scattering for Trace-Level Component…
 Evaluation of Reflectance of Microlens Surface using…
 Base Material and Dye Analysis - Combined Raman and…
 Analysis of Carbon Products using Raman Spectroscopy
 Compositional Analysis of Rocks by using of…