Introduction
Rust that occurs when iron materials corrode has various oxidation states and crystal structures, such as Fe2O3, Fe3O4, and FeOOH, resulting in differences in Raman spectra (Figure 1).
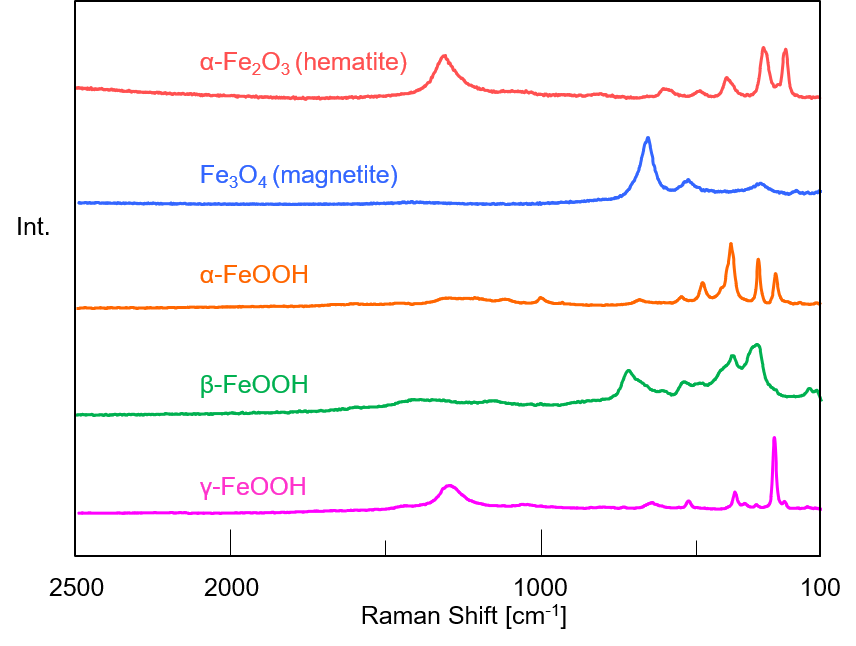
Figure 1. Raman spectra of iron oxides and hydroxides
Since the type of rust that occurs depends on the exposure environment, analysis of the oxidation state of the rust can lead to elucidation of the causes of corrosion, and the necessary steps to prevent it. This article shows the results of analysis of oxidation states on the surface of iron materials using a micro Raman spectrometer.
NRS-5500 Raman spectrometer
Experimental
Samples
Two samples* taken from different environments (indoor and outdoor) were analyzed.
*Details of the environment in which the samplers were previously exposed, both indoors and outdoors at the time of sampling are unknown.
Measurement conditions
Ex wavelength: 532 nm
Exposure time: 15 seconds
Accumulation: 1 time
Objective lens: 100x, long work distance for dark field observation
Data interval: 2 µm
Measurement points: 11 x 11 points (20 µm square)
Since the surface of rusted metal has a lot of irregularities, Surface Scan Imaging (SSI) was used for imaging measurement along the irregularities. SSI has the ability to quickly image and map rough or uneven samples.
Results
Point measurements for each rust sample
Multiple spectra from different oxidation states such as α-Fe2O3 and Fe3O4 were obtained from samples collected indoors, with γ-FeOOH being mostly detected from samples collected from outdoor samples (Figure 2).
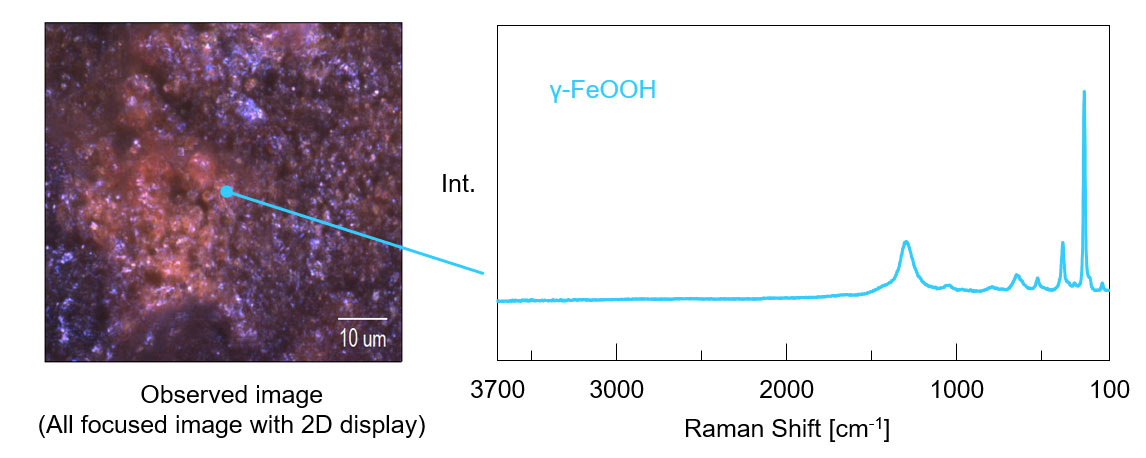
Figure 2. Results of samples collected outdoors
Imaging measurement of samples collected indoors (evaluation of component distribution)
Three different spectra were obtained. Here, the typical spectrum of each component was used as the reference spectrum (the spectra are shown in Figure 3), and a chemical image was created using the correlation (similarity) with the reference spectrum. Using a false-color map to create a chemical image, it is possible to visualize the component distribution that may be difficult to determine visually, which is thought useful for analyzing the cause of corrosion.
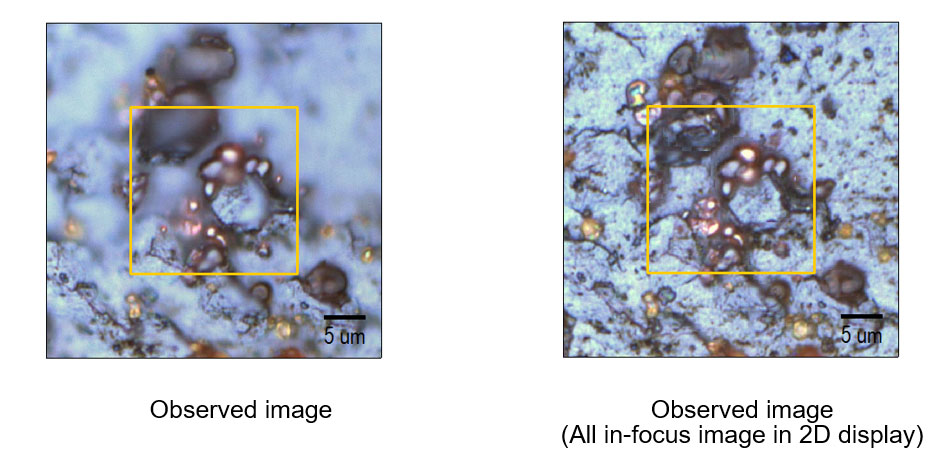
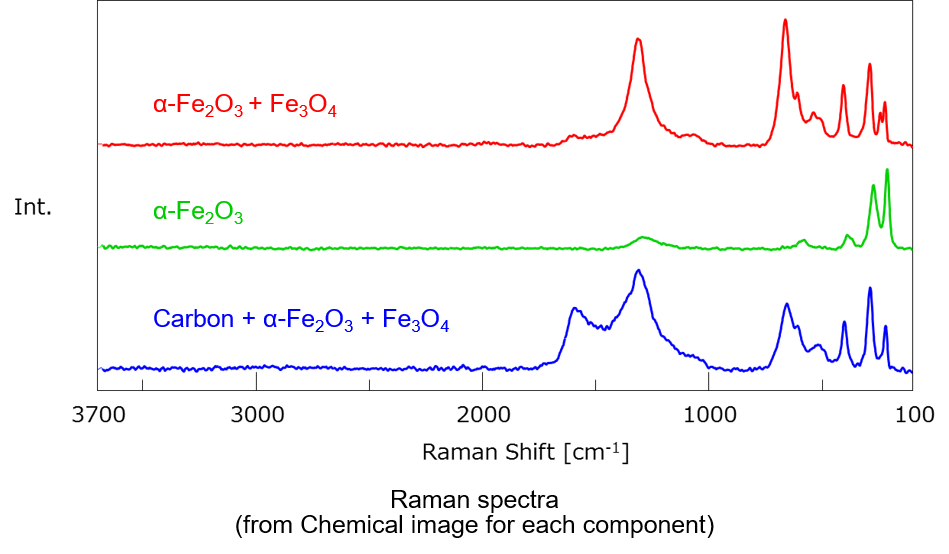
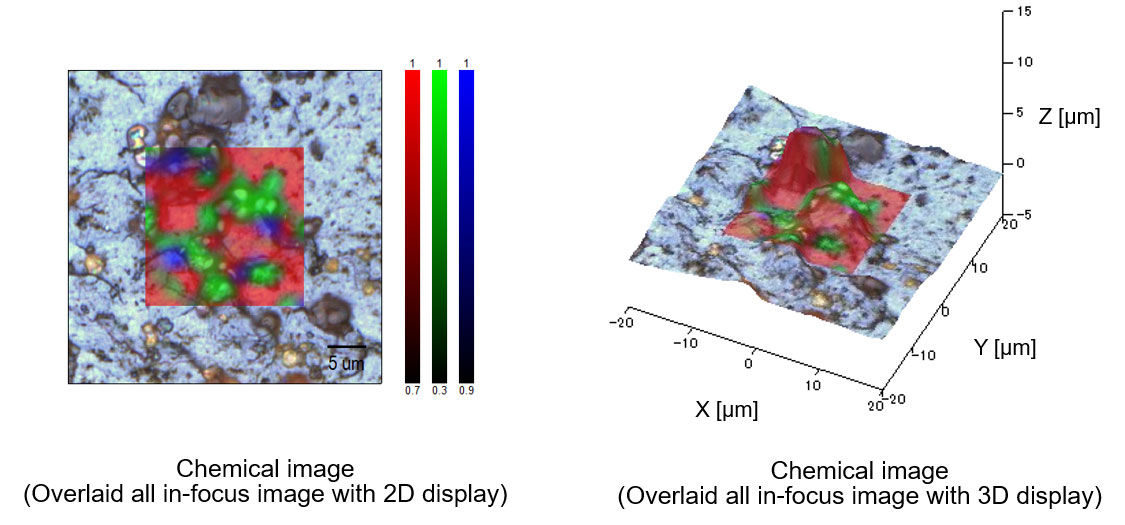
Figure 3. Measurement results of sample collected indoors
Conclusion
Using Raman spectroscopy it is possible to analyze the oxidation state and crystal structure of inorganic substances, such as rust,. In addition, SSI is a very effective tool for imaging measurement of samples with an uneven surface such as rust.


