Introduction
The SAH-769 One Drop accessory is used for fast and accurate quantitation of small volume of proteins and nucleic acids. To make a measurement a single drop of sample is pipetted onto the cell (5μL for 1mm or 0.6μL for 0.2 mm optical pathlengths respectively).
This application note demonstrates both the reproducibility and linearity of the SAH-769 One Drop accessory using calf thymus DNA with both 1 m and 0.2 mm pathlength cells.
V-730 UV-Visible Spectrophotometer
Experimental
| Measurement Conditions | |||
| Wavelength | 260 nm | Bandwidth | 1.5 nm |
| Response | Medium | ||
A drop of sample was dispensed, measured, and repeated 10 times. The sample was wiped from the cell in between measurements. The procedure can be seen in Figure 1.
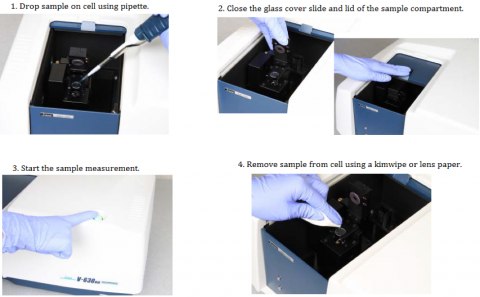
Figure 1. Measurement procedure using the SAH-769 One Drop accessory.
Keywords
UV-0021, V-730, UV-Visible/NIR, Biochemistry, SAH-769 One Drop, Microsampling
Results
The absorption values obtained using a 1 mm pathlength cell are shown in Table 1 and the calibration curve in Figure 2. Table 2 illustrates the reproducibility of the concentration values calculated from the absorbance data.
Table 1. SAH-769 absorbance measurement reproducibility using a 1 mm pathlength cell.
| ng/µL | 0 | 2.4 | 4.8 | 9.6 | 19.3 | 38.6 | 77.2 | 154.4 | 308.8 | 617.5 |
| 1 | -0.0008 | 0.0047 | 0.0084 | 0.0179 | 0.0321 | 0.0676 | 0.133 | 0.259 | 0.516 | 0.998 |
| 2 | 0.0003 | 0.0059 | 0.0093 | 0.0146 | 0.0332 | 0.0677 | 0.131 | 0.260 | 0.518 | 1.003 |
| 3 | 0.0012 | 0.0056 | 0.0083 | 0.0162 | 0.0334 | 0.0705 | 0.130 | 0.260 | 0.519 | 1.003 |
| 4 | 0.0015 | 0.0063 | 0.0072 | 0.0181 | 0.0345 | 0.0679 | 0.130 | 0.262 | 0.512 | 1.024 |
| 5 | -0.0002 | 0.0067 | 0.0071 | 0.0166 | 0.0329 | 0.0676 | 0.132 | 0.264 | 0.517 | 0.993 |
| 6 | -0.0013 | 0.0053 | 0.0088 | 0.0204 | 0.0331 | 0.0672 | 0.130 | 0.259 | 0.522 | 0.996 |
| 7 | 0.0013 | 0.0049 | 0.0082 | 0.0170 | 0.0336 | 0.0695 | 0.129 | 0.259 | 0.511 | 0.996 |
| 8 | 0.0002 | 0.0036 | 0.0089 | 0.0168 | 0.0326 | 0.0680 | 0.133 | 0.260 | 0.509 | 1.006 |
| 9 | 0.0027 | 0.0058 | 0.0089 | 0.0177 | 0.0315 | 0.0676 | 0.134 | 0.260 | 0.509 | 1.000 |
| 10 | -0.0004 | 0.0043 | 0.0069 | 0.0153 | 0.0353 | 0.0692 | 0.132 | 0.267 | 0.509 | 0.995 |
| Avg. | 0.0004 | 0.0053 | 0.0082 | 0.0171 | 0.0332 | 0.0683 | 0.131 | 0.261 | 0.514 | 1.001 |
| S.D. | 0.0012 | 0.0010 | 0.0008 | 0.0016 | 0.0011 | 0.0011 | 0.0015 | 0.0026 | 0.0047 | 0.0089 |
| C.V. % | N/A | 17.9 | 10.3 | 9.6 | 3.3 | 1.6 | 1.2 | 1.0 | 0.9 | 0.9 |
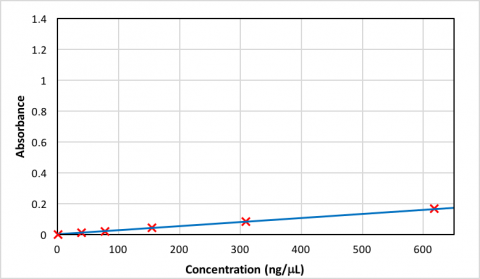
Table 2. Concentration reproducibility using a 1 mm pathlength cell.
| ng/µL | 0 | 2.4 | 4.8 | 9.6 | 19.3 | 38.6 | 77.2 | 154.4 | 308.8 | 617.5 |
| 1 | -2.8 | 0.6 | 2.9 | 8.8 | 17.5 | 39.3 | 79.8 | 157.3 | 315.0 | 611.5 |
| 2 | -2.1 | 1.4 | 3.4 | 6.7 | 18.2 | 39.4 | 78.0 | 157.7 | 316.3 | 614.6 |
| 3 | -1.5 | 1.2 | 2.9 | 7.7 | 18.3 | 41.1 | 78.0 | 157.9 | 316.9 | 614.7 |
| 4 | -1.3 | 1.7 | 2.2 | 8.9 | 18.9 | 39.5 | 77.7 | 158.8 | 312.4 | 627.6 |
| 5 | -2.4 | 19. | 2.1 | 8.0 | 18.0 | 39.3 | 78.7 | 160.0 | 316.0 | 608.8 |
| 6 | -3.1 | 1.0 | 3.1 | 10.3 | 18.1 | 39.1 | 77.5 | 157.0 | 318.7 | 610.4 |
| 7 | -1.4 | 0.7 | 2.8 | 8.2 | 18.4 | 40.5 | 77.4 | 157.1 | 312.0 | 610.3 |
| 8 | -2.1 | 0.0 | 3.2 | 8.1 | 17.8 | 39.6 | 79.3 | 157.8 | 311.1 | 616.5 |
| 9 | -0.6 | 1.3 | 3.2 | 8.6 | 17.1 | 39.3 | 80.0 | 157.4 | 310.9 | 612.8 |
| 10 | -2.5 | 0.4 | 2.0 | 7.1 | 19.5 | 40.3 | 78.9 | 162.2 | 311.0 | 609.9 |
| Avg. | -2.0 | 1.0 | 2.8 | 8.2 | 18.2 | 39.8 | 78.5 | 158.3 | 314.0 | 613.7 |
| S.D. | 0.75 | 0.59 | 0.52 | 1.00 | 0.68 | 0.66 | 0.95 | 1.63 | 2.88 | 5.48 |
| C.V. % | N/A | 57.4 | 18.7 | 12.2 | 3.7 | 1.7 | 1.2 | 1.0 | 0.9 | 0.9 |
| *Detection limit: 50 ng/µL *Quantitation limit: 100 ng/µL |
||||||||||
The absorption values obtained using a 0.2 mm pathlength cell are shown in Table 3 and the calibration curve in Figure 3. Table 4 illustrates the reproducibility of the concentration values calculated from the absorbance data.
Table 3. SAH-769 absorbance measurement reproducibility using a 0.2 mm pathlength cell.
| ng/µL | 0 | 38.6 | 77.2 | 154.4 | 308.8 | 617.5 | 1235 | 2470 | 4940 |
| 1 | 0.0008 | 0.0122 | 0.0196 | 0.0460 | 0.0842 | 0.166 | 0.326 | 0.646 | 1.297 |
| 2 | -0.0011 | 0.0165 | 0.0223 | 0.0430 | 0.0847 | 0.166 | 0.330 | 0.645 | 1.319 |
| 3 | -0.0001 | 0.0160 | 0.0195 | 0.0427 | 0.0873 | 0.170 | 0.328 | 0.653 | 1.320 |
| 4 | -0.0004 | 0.0112 | 0.0176 | 0.0430 | 0.0863 | 0.165 | 0.331 | 0.654 | 1.284 |
| 5 | 0.0069 | 0.0152 | 0.0180 | 0.0410 | 0.0860 | 0.168 | 0.327 | 0.647 | 1.307 |
| 6 | -0.0005 | 0.0139 | 0.0184 | 0.0424 | 0.0845 | 0.170 | 0.326 | 0.660 | 1.303 |
| 7 | 0.0006 | 0.0137 | 0.0206 | 0.0450 | 0.0839 | 0.170 | 0.331 | 0.659 | 1.312 |
| 8 | 0.0019 | 0.0127 | 0.0200 | 0.0440 | 0.0875 | 0.168 | 0.330 | 0.658 | 1.301 |
| 9 | 0.0011 | 0.0130 | 0.0212 | 0.0435 | 0.0851 | 0.169 | 0.338 | 0.663 | 1.296 |
| 10 | 0.0007 | 0.0134 | 0.0194 | 0.0426 | 0.0879 | 0.171 | 0.326 | 0.664 | 1.308 |
| Avg. | 0.0010 | 0.0138 | 0.0197 | 0.0433 | 0.0857 | 0.168 | 0.329 | 0.655 | 1.305 |
| S.D. | 0.0012 | 0.0017 | 0.0015 | 0.0014 | 0.0015 | 0.0020 | 0.0037 | 0.0071 | 0.0110 |
| C.V. % | N/A | 12.2 | 7.4 | 3.3 | 1.7 | 1.2 | 1.1 | 1.1 | 0.8 |
The absorption values obtained using a 0.2 mm pathlength cell are shown in Table 3 and the calibration curve in Figure 3. Table 4 illustrates the reproducibility of the concentration values calculated from the absorbance data.
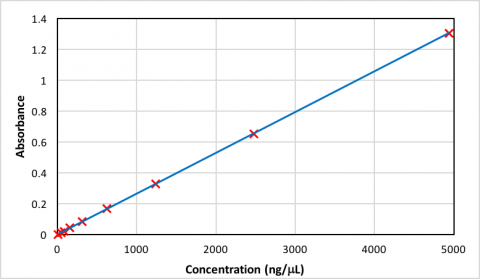
Table 4. Concentration reproducibility using a 0.2 mm pathlength cell.
| ng/µL | 0 | 38.6 | 77.2 | 154.4 | 308.8 | 617.5 | 1235 | 2470 | 4940 |
| 1 | 0.0008 | 0.0122 | 0.0196 | 0.0460 | 0.0842 | 0.166 | 0.326 | 0.646 | 1.297 |
| 2 | -0.0011 | 0.0165 | 0.0223 | 0.0430 | 0.0847 | 0.166 | 0.330 | 0.645 | 1.319 |
| 3 | -0.0001 | 0.0160 | 0.0195 | 0.0427 | 0.0873 | 0.170 | 0.328 | 0.653 | 1.320 |
| 4 | -0.0004 | 0.0112 | 0.0176 | 0.0430 | 0.0863 | 0.165 | 0.331 | 0.654 | 1.284 |
| 5 | 0.0069 | 0.0152 | 0.0180 | 0.0410 | 0.0860 | 0.168 | 0.327 | 0.647 | 1.307 |
| 6 | -0.0005 | 0.0139 | 0.0184 | 0.0424 | 0.0845 | 0.170 | 0.326 | 0.660 | 1.303 |
| 7 | 0.0006 | 0.0137 | 0.0206 | 0.0450 | 0.0839 | 0.170 | 0.331 | 0.659 | 1.312 |
| 8 | 0.0019 | 0.0127 | 0.0200 | 0.0440 | 0.0875 | 0.168 | 0.330 | 0.658 | 1.301 |
| 9 | 0.0011 | 0.0130 | 0.0212 | 0.0435 | 0.0851 | 0.169 | 0.338 | 0.663 | 1.296 |
| 10 | 0.0007 | 0.0134 | 0.0194 | 0.0426 | 0.0879 | 0.171 | 0.326 | 0.664 | 1.308 |
| Avg. | 0.0010 | 0.0138 | 0.0197 | 0.0433 | 0.0857 | 0.168 | 0.329 | 0.655 | 1.305 |
| S.D. | 0.0012 | 0.0017 | 0.0015 | 0.0014 | 0.0015 | 0.0020 | 0.0037 | 0.0071 | 0.0110 |
| C.V. % | N/A | 12.2 | 7.4 | 3.3 | 1.7 | 1.2 | 1.1 | 1.1 | 0.8 |
| *Detection limit: 50 ng/µL *Quantitation limit: 100 ng/µL |
|||||||||
*The detection limit is calculated using 3.3σ. The quantitation limit is calculated using 10σ. σ is the standard deviation in 0 ng/µL of sample concentration.
Related Posts:
 Evaluation of Reflectance of Microlens Surface using…
 Measurement of alanine powder using DRCD with…
 Fluorescence Observation and Foreign Materials…
 GPC/SEC measurement of Polystyrene Oligomers using…
 Evaluation of Spectral Characteristics of Dichroic…
 Highly efficient spectral measurement methods using…