Introduction
The haze measurement of a transparent sample describes the amount of light scattered when light passes through a transparent sample. The lower the haze measurement value, the higher the clarity of the sample indicating fewer impurities.
In this article, the haze measurement value and total light transmittance in a sample of diffuser panels is reported, using measurement methods based on JIS, ISO, and ASTM standard procedures.
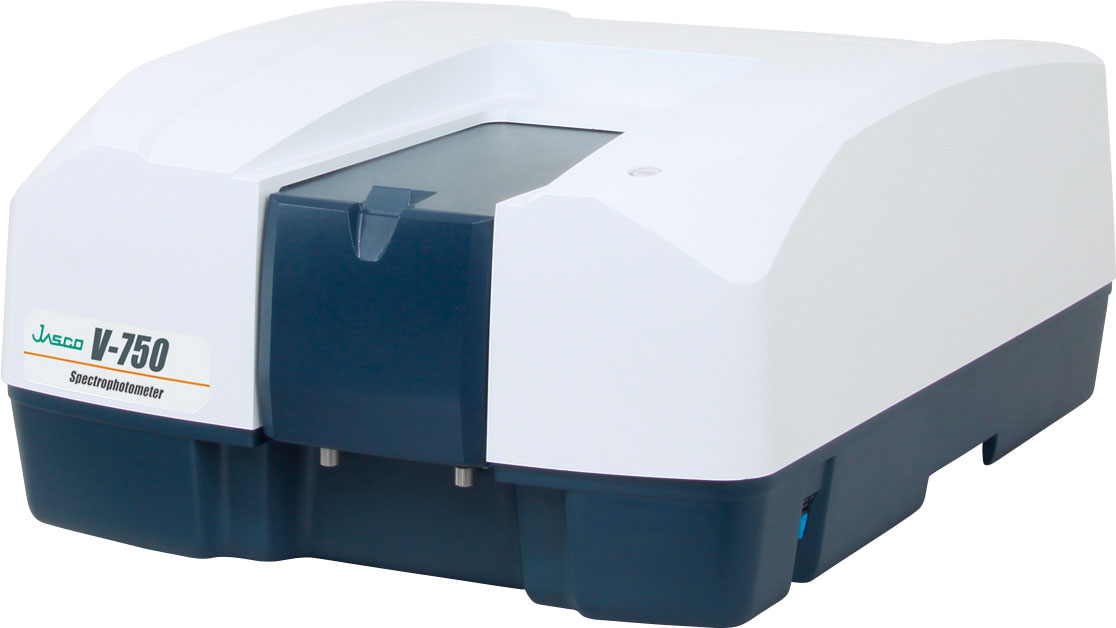
V-750 UV/Vis spectrophotometer
Experimental
Figure 1 illustrates how the total transmittance (Tt), sample diffusion rate (T4), and scattering rate (T3) are obtained using an integrating sphere. The baseline spectrum is obtained using a white diffuse reference plate (1) and the light scattered by the instrument itself is measured (T3) in order to calibrate the spectrophotometer.
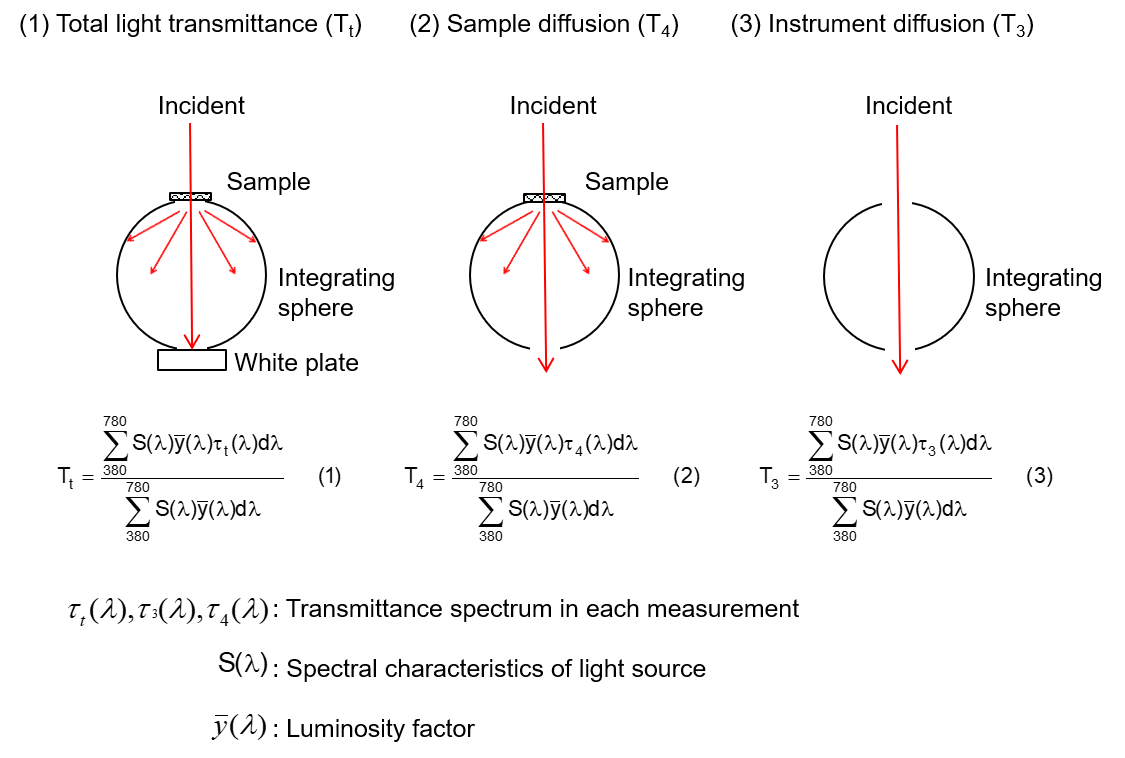
Figure 1. Haze value measurement setup and equations.
The total light transmittance and sample diffusion of the sample is then measured, and the diffuse transmittance and the haze value are calculated:

Measurement Conditions
Bandwidth: 5 nm
Scan Speed: 400 nm/min
Response: 0.24 sec
Data Interval: 1 nm
Light Source: D65
View Angle: 2°
Samples
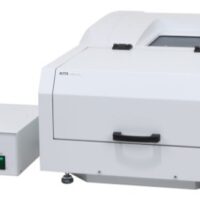
6 kinds of diffuser plate
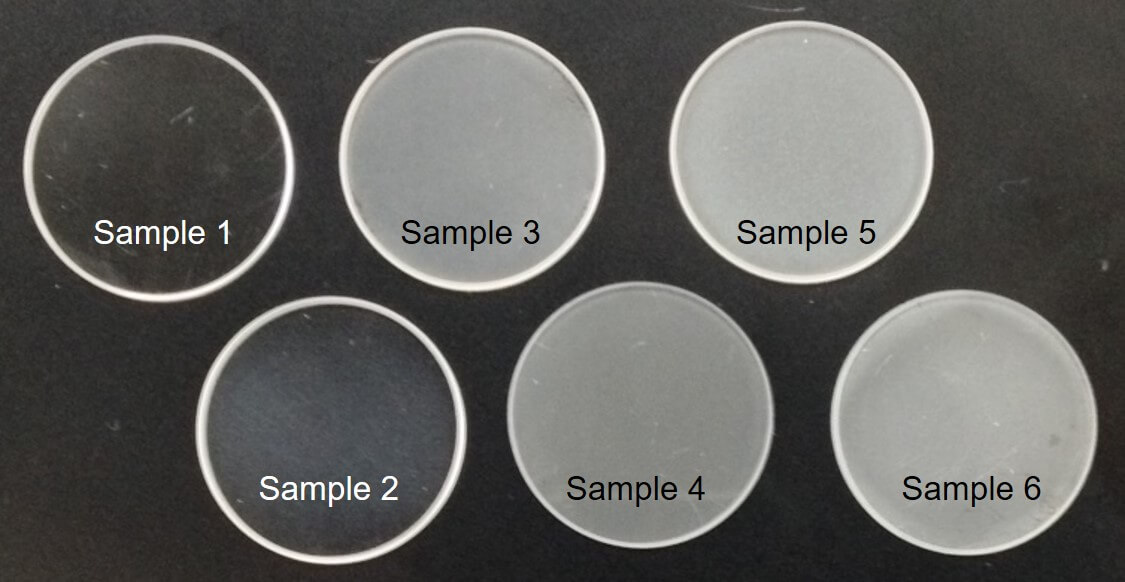
Diffuser plates
Keywords
UV-Visible/NIR, Haze, Diffuse transmittance, Materials, Integrating sphere
Results
The spectrum of the total light transmittance (τt) and the sample diffusion rate (τ4) of the quartz diffuser plates are shown in Figure 2. The calculated haze values are shown in Table 1. The spectra and haze values clearly indicate a difference in samples 3, 4, 5, and 6.
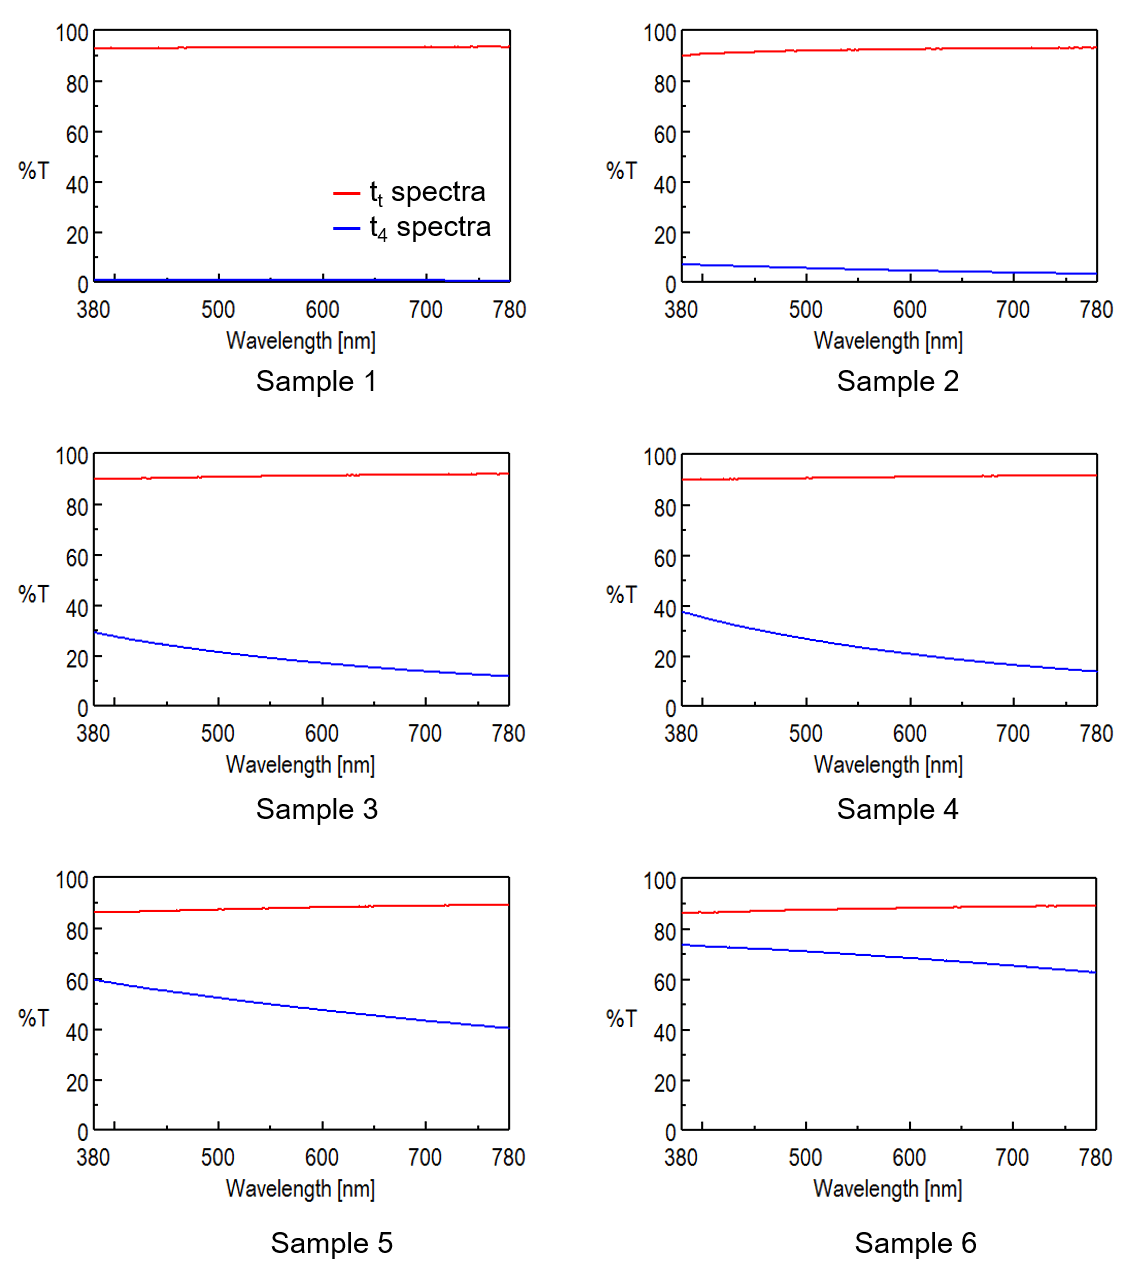
Figure 2. Transmittance spectra of six diffuser plate samples.
Table 1. Calculated haze values for diffuser panels.
| T3[%] | Tt[%] | T4[%] | Td[%] | Haze [%] | |
| 1 | 0.08 | 93.06 | 0.71 | 0.63 | 0.7 |
| 2 | 0.08 | 92.13 | 4.94 | 4.86 | 5.3 |
| 3 | 0.08 | 90.88 | 18.7 | 18.62 | 20.5 |
| 4 | 0.08 | 90.8 | 23.12 | 23.04 | 25.4 |
| 5 | 0.08 | 87.75 | 69.34 | 69.27 | 78.9 |
| 6 | 0.08 | 85.46 | 70.56 | 70.49 | 82.5 |


