Introduction
Circular dichroism (CD) spectroscopy is widely used in the study of optically active substances. In recent years, circularly polarized luminescence (CPL) spectroscopy has also attracted a great deal of attention. Whereas CD spectroscopy provides information about the structure of optically active substances in the ground electronic state, CPL spectroscopy provides information about excited states. The two methods are therefore complementary to each other.
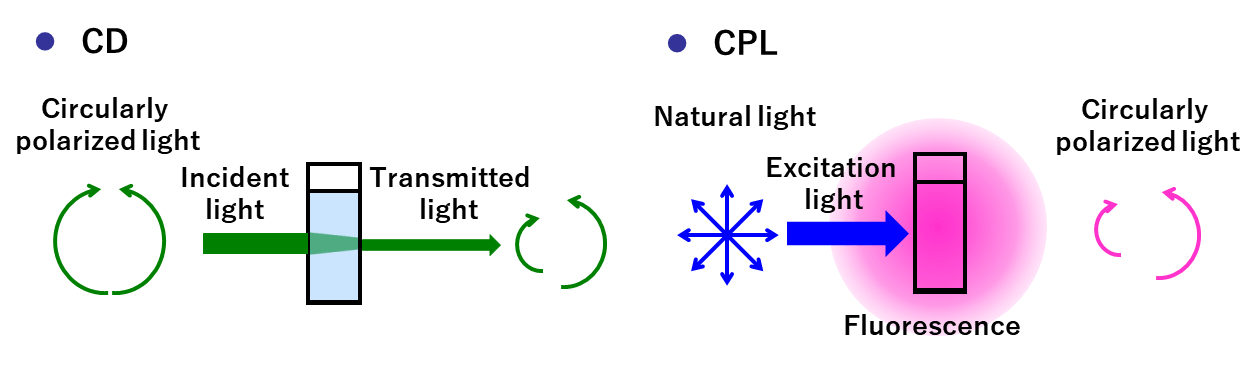
Fig.1 Difference between CD and CPL
Materials that exhibit circularly polarized luminescence are currently being actively investigated for applications in fields such as liquid crystal display backlights, three dimensional (3D) displays, holographic displays, light sources for controlling plant growth, and security systems for optical communications and printing. It is therefore important to identify molecules that emit one-handed circularly polarized light (CPL) with a high quantum yield. CPL spectra contain important information such as the stable structure of excited molecules, and the behavior of these molecules in chemical reactions that involve an intermediate excited state. Generally, fluorescence signals from a sample are weak and CPL signals are even weaker, making them difficult to detect. The JASCO CPL-300 achieves high sensitivity for detecting such weak CPL signals and allows measurements to be performed over a wide wavelength range.
CPL-300
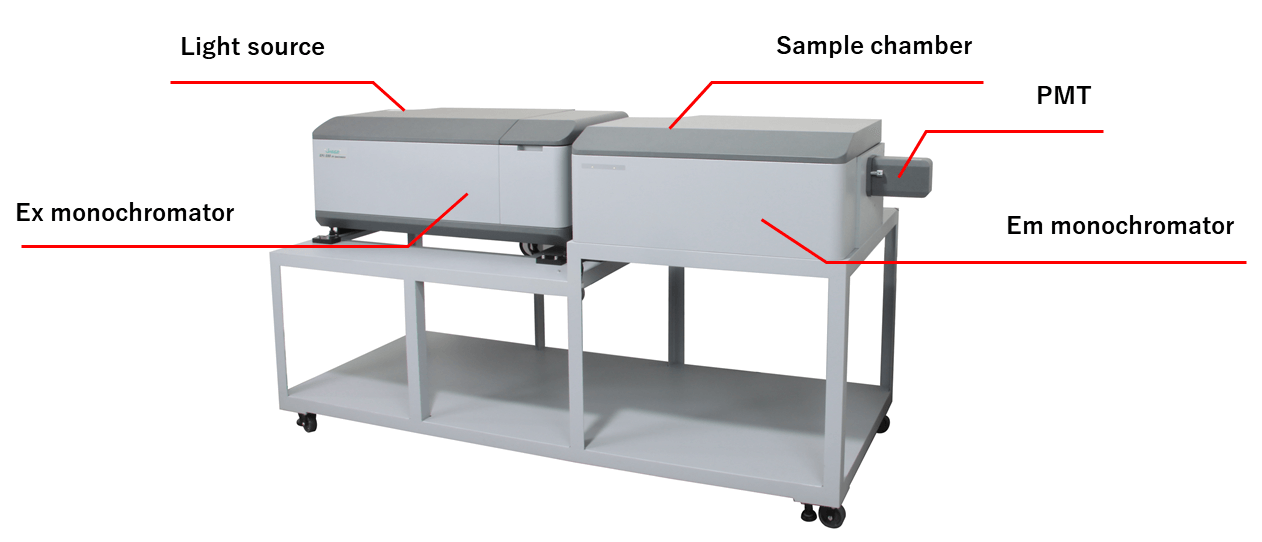
Fig.2 CPL-300 CPL spectrophotometer
Optical System
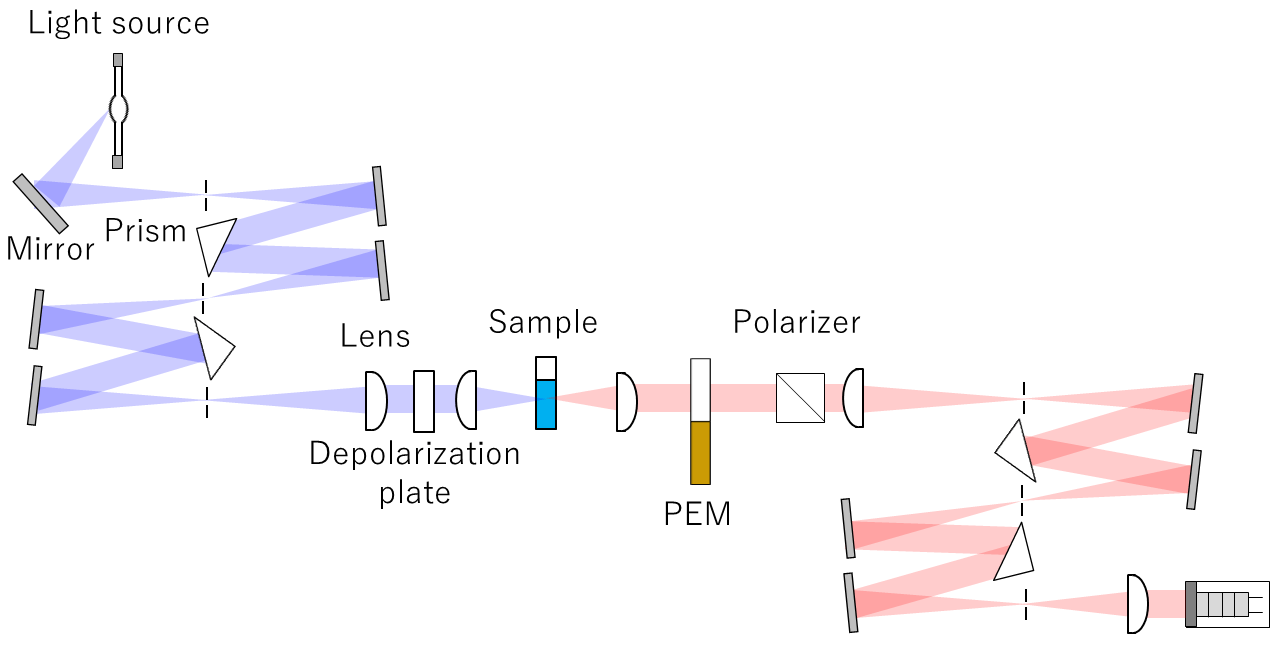
Fig.3 Optical system for CPL-300
Light from a light source is first passed through a monochromator, and the sample is then irradiated by non-polarized light. The left- and right-handed circularly polarized fluorescence emitted by the sample is alternately linearly polarized at a frequency of 50 kHz using a PEM. A polarizer is placed at the back of the PEM, and the polarized fluorescence is transmitted synchronously with the modulation of the PEM, and is passed through a monochromator and then detected by a detector.
Features
● Double-prism monochromator
Low stray light, no second-order radiation and no Wood’s anomalies to minimize artifacts.
● 180° sample geometry with unpolarized excitation light
Samples with different transition moments for absorption and fluorescence, and do not become depolarized, can be measured
● Excitation (Ex) and emission (Em) monochromators
Possible to set optimized Ex wavelength and Em spectral bandwidth
● High-throughput optical system and highly sensitive PMT
Increased fluorescence sensitivity
● Data collection and processing
Simultaneous measurements of CPL and fluorescence intensity
One-click data conversion to DI and *glum
*glum: luminescence dissymmetry factor
Experimental
High-resolution measurements of complexes exhibiting very narrow CPL and fluorescence bands
Lanthanoid complexes are widely used as LED materials because of their strong sharp optical emission. They also have potential applications in products such as 3D displays and security markers, and synthesis and evaluation of lanthanoid complexes exhibiting CPL are underway.
The figure on the right shows the change in the CPL spectrum of Eu(facam)3 with fluorescence bandwidth (SBW). Even for compounds producing a very sharp CPL spectrum like Eu(facam)3, the CPL-300 is capable of high-resolution measurements with a small fluorescence bandwidth.
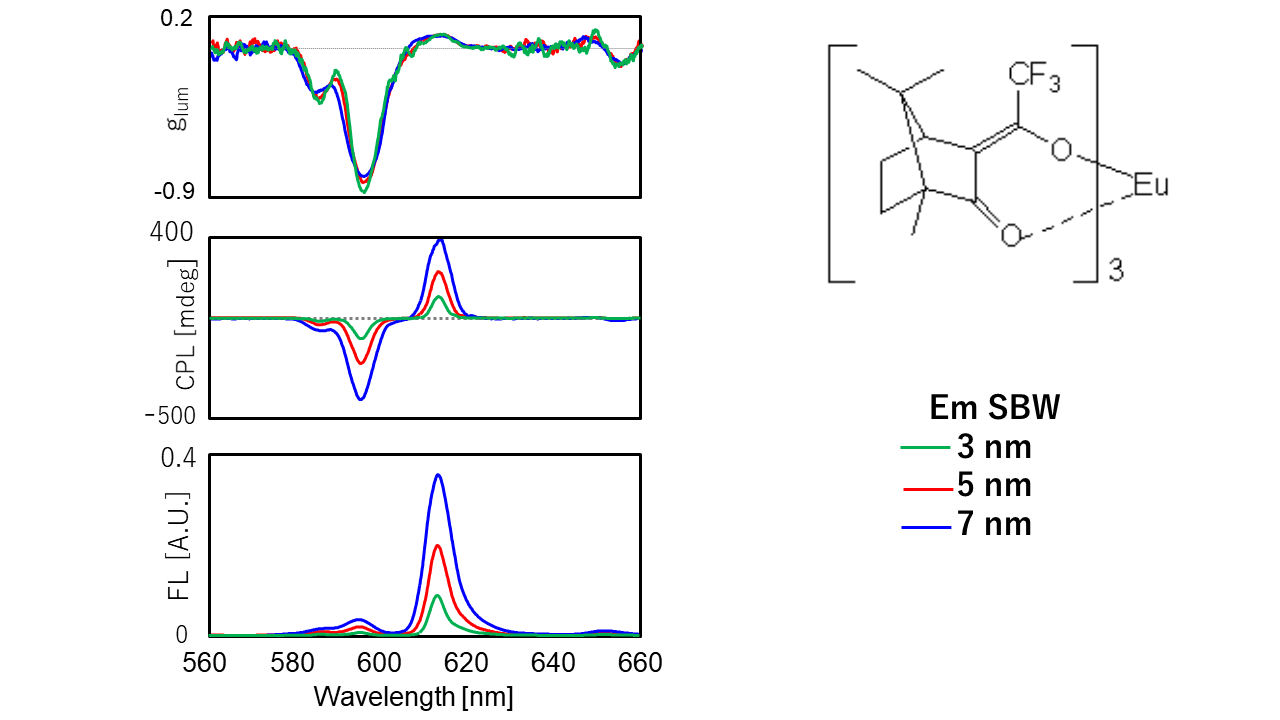
Fig.4 High-resolution CPL spectra of Eu(facam)3
High-sensitivity measurements of green fluorescent protein (GFP)

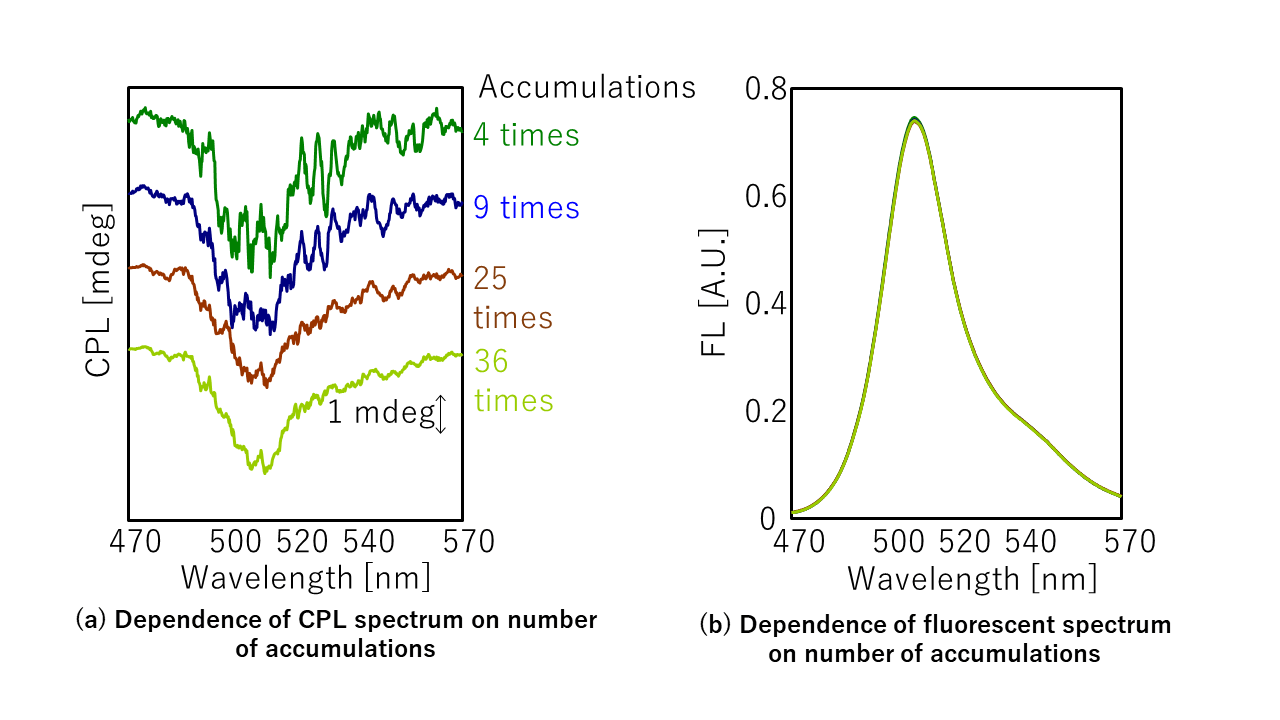
Fig.5 CPL and fluorescence spectra of wild-type GFP
Fig.5 (a) shows CPL spectra of wild-type GFP. Although the sample concentration was only 30 μg/mL and the optical path length was only 10 mm, the CPL spectrum could be clearly observed by increasing the number of accumulations.
Although the S/N could be further improved by using a larger number of accumulations, proteins can become photodegraded under prolonged illumination. Therefore, the temporal change in the fluorescence spectrum was monitored. Fig.5 (b) shows the 1st, 9th, 25th and 36th fluorescence spectrum obtained during the CPL measurements. It can be seen that even after 36 accumulations, no change in the spectral shape occurred.
Measurements of Solid Samples
In the case of a solid sample containing a powder, the spectrum may be affected by artifacts due to birefringence. To determine whether such artifacts are present, it is necessary to measure enantiomers to obtain symmetric spectra, and to rotate the sample around the optical axis to find whether the spectral shape changes or not.
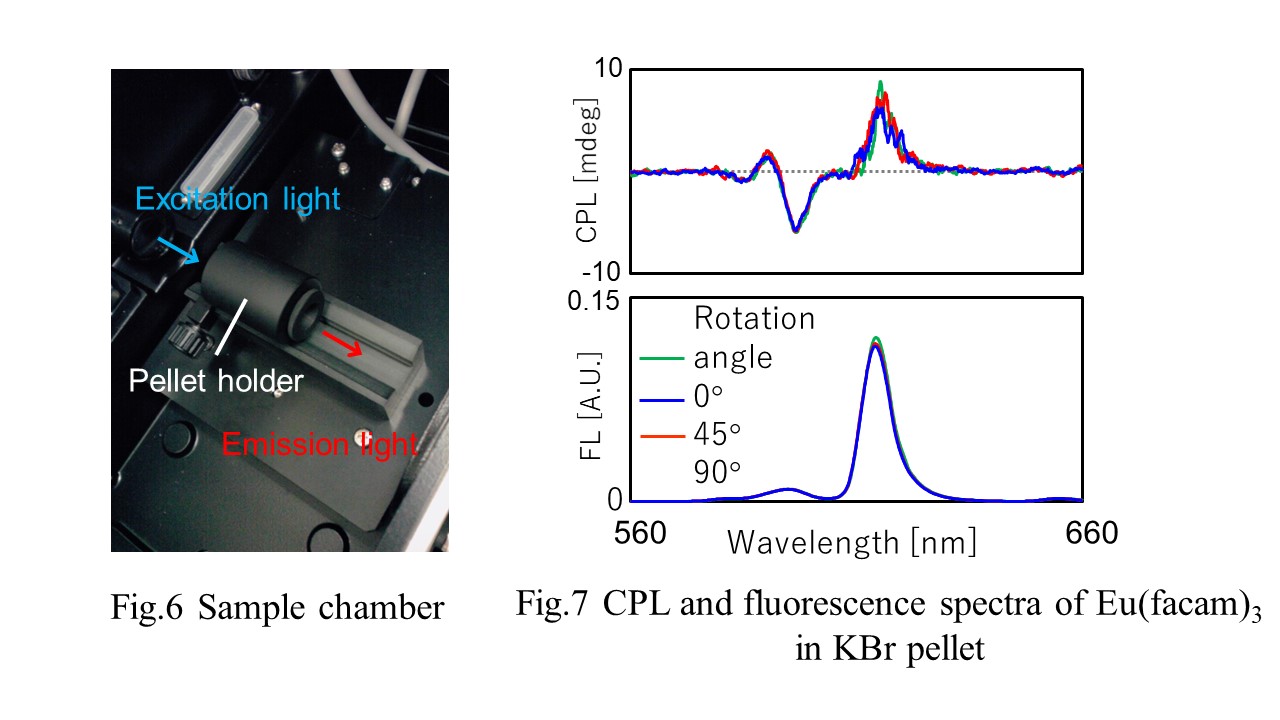
Fig.7 shows spectra of powdered Eu(facam)3 in a KBr pellet measured using this pellet holder. The spectra were obtained at rotation angles of 0°, 45° and 90°. It can be seen that there is no significant change in spectral shape with rotation angle, indicating anisotropy artifact free.
Magnetic CPL
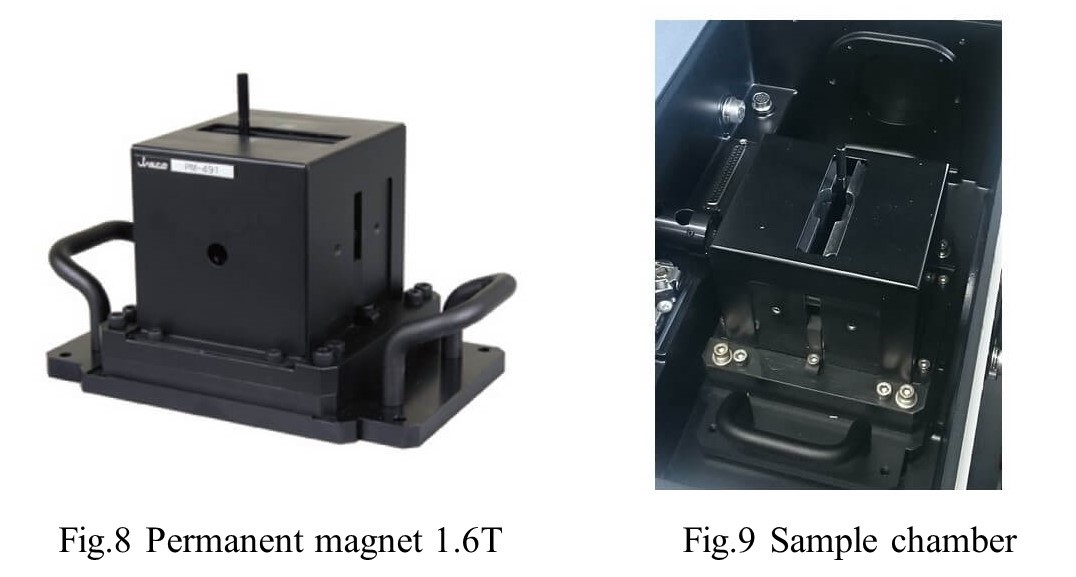
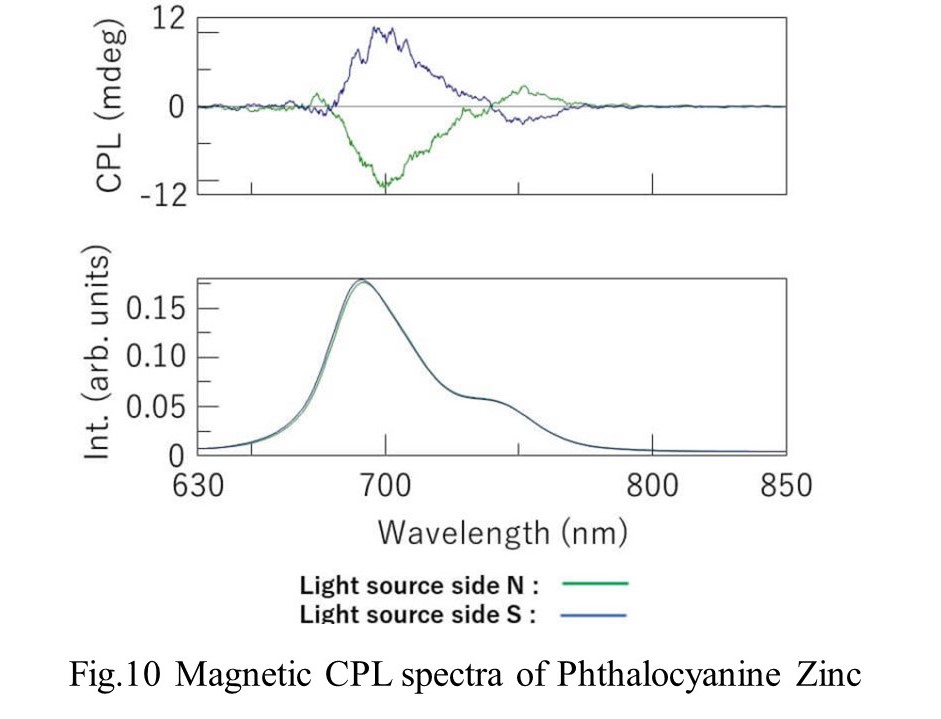
The CPL spectrum shape is inverted according to the direction of magnetic field
Conclusion
● CPL spectroscopy is receiving increasing attention as chiro optical spectroscopy.
● The CPL-300 has capability of high-resolution, high-sensitivity and artifact-free measurements.
● The CPL-300 is expected to contribute to the promotion of further research into CPL materials for use in applications such as 3D displays and security ink.
References
Poster Session at International Symposium on Circularly Polarized Luminescence and Related Phenomena (2019 January 22, Tokyo Metropolitan University, Minami-Osawa Campus)
Satoko Suzuki, Yoshiro Kondo, Ken-ichi Akao and Koushi Nagamori
JASCO Corporation, Tokyo, Japan
 properties of platinum complexes using a CPL measurement system and a spectrofluorometer")
 spectroscopy")


