Introduction
Polyethylene terephthalate (PET) is a polymer with applications such as food containers and synthetic fibers. However, PET undergoes degradation due to factors such as exposure to ultraviolet light and repeated recycling. Quantitatively evaluating the associated changes in physical properties is important for developing products made from PET and controlling their quality. One method for performing such evaluations of polymer raw materials involves the use of gel permeation chromatography (GPC) to determine the molecular weight distribution. When analyzing PET by GPC, hexafluoroisopropanol (HFIP) is typically used. However, since HFIP is an extremely expensive solvent, excessive solvent consumption becomes problematic. One means of reducing solvent consumption is to perform the analysis on a semi-micro scale. This also offers the advantage of shorter analysis times.
In this study, we investigated the degradation of PET test samples caused by irradiation in a xenon accelerated weathering tester. Color changes were measured using a UV-Vis spectrophotometer, and changes in the molecular weight distribution were evaluated using a GPC system. This was a semi-micro scale GPC system compatible with HFIP, equipped with a refractive index detector (RI-4035) and a high-performance analytical GPC column. For data analysis, we used the molecular weight distribution calculation program in ChromNAV. We created a molecular weight calibration curve using polymethyl methacrylate (PMMA) as the standard sample and calculated the molecular weight distribution of PET sample.
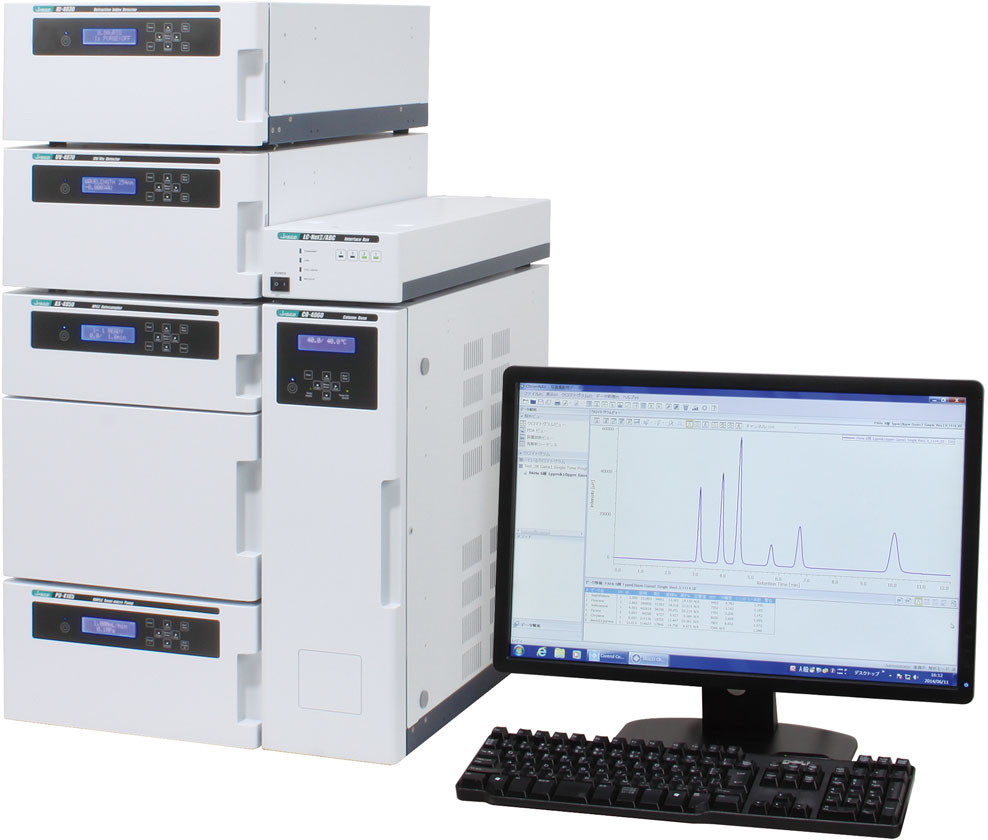
LC-4000 GPC system
Experimental
LC system
Pump: PU-4185
Autosampler: AS-4150*
Column oven: CO-4060
Detector: RI-4035
* with option units
LC conditions
Column: GPC LF-404 (4.6 mmI.D. x 250 mmL, 6 µm)
Eluent: 5 mmol/L sodium trifluoroacetate in HFIP
Flow rate: 0.15 mL/min
Column temp.: 40 ºC
Injection volume: 20 µL
UV-Vis system
Instrument: V-750 UV-Vis spectrophotometer
Accessories: ISV-922 Integrating sphere unit
VWCD-960 Color evaluation (color diagnosis) program
UV-Vis conditions
Measurement range: 340 nm–800 nm
Light source: D2/WI
Data interval: 1 nm
Bandwidth: 5 nm
Response: 0.24 sec
Scan speed: 400 nm/min
Accumulations: 1
Sample
– Standard samples for creating molecular weight calibration curve
Polymethyl methacrylate (PMMA) mixed sample
(two samples prepared for different molecular weight peaks (Mp))
Standard sample 1: Mp 772000, 51900, 6900, 645
Standard sample 2: Mp 211000, 21700, 2200
Each sample was dissolved and diluted in the mobile phase to 0.025 % (w/v)
– Test samples for evaluation
PET test pieces (approx. 10 mm x 10 mm x 2 mm, Standard Test Piece Co., Ltd.)
Structure

PET
Keywords
PA6, GPC, molecular weight distribution, PMMA, molecular weight calibration curve, HFIP, semimicro scale, RI detector
Results
Figure 1 shows the procedure used for the photodegradation test. For light irradiation, a xenon accelerated weathering tester (SOLARBOX 1500e, manufactured by Cofomegra, provided by JASCO INTERNATIONAL Co., Ltd.) was used, with irradiation performed at an irradiance of 60 W/m² and a temperature of 65 ºC. Three test samples were sequentially inserted into the weathering tester at different times to give total irradiation times of 10 days, 5 days, and 1 day for Samples 1, 2 and 3, respectively. After irradiation was completed, the test sample were observed to change color from transparent to yellow, as shown in Figure 2. The samples were measured using a V-750 UV-Vis spectrophotometer to calculate the color (L*, a*, b*) and yellowness (YI, Yellow Index) in order to quantitatively evaluate the degree of degradation.
Furthermore, to measure the degraded layer of the test samples using GPC, Plane type Slicer (Slice Master KS-10, provided by JASCO Engineering Co., Ltd.) was used to remove the degraded layer from the irradiated surface of the test samples. The cut fragments were dissolved in the mobile phase to a concentration of 0.1 % (w/v) for use as the GPC measurement samples.

Fig. 1 Photodegradation test procedure
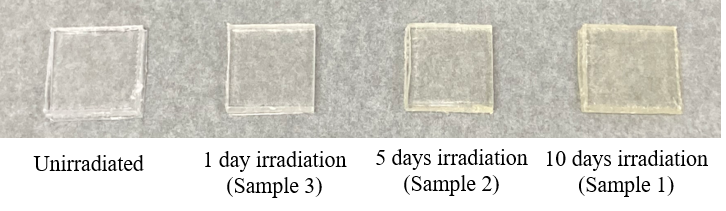
Fig. 2 Color change in PET test samples
Figure 3 shows the chromaticity coordinates for the different PET test samples measured using a UV-Vis spectrophotometer. Table 1 shows the calculated results for color (L*, a*, b*) and yellowness (YI), and Figure 4 shows the change in b* and YI with respect to irradiation time. As the irradiation time increased, the values of b* and YI became more positive, confirming a shift toward the yellow direction. This is thought to result from PET possessing aromatic rings with conjugated double bonds, whose chemical structure is altered by UV irradiation, forming new conjugated systems2).
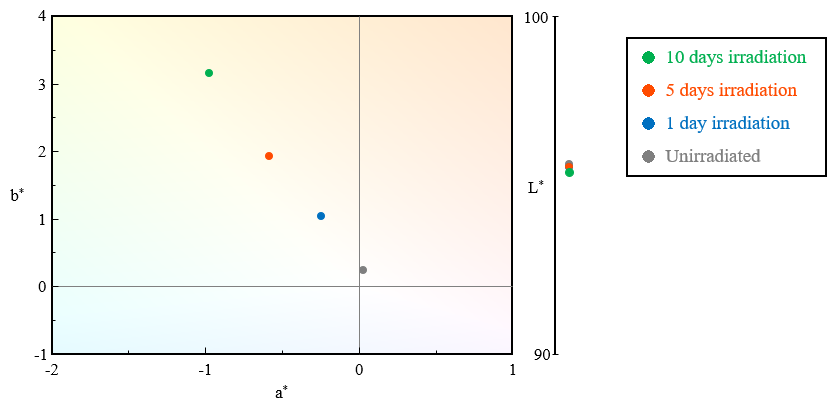
Fig. 3 Chromaticity coordinates for PET test samples
Table 1 Calculated chromaticity results for PET test samples
| Sample | L* | a* | b* | YI |
| Unirradiated | 95.6 | 0.03 | 0.24 | 0.49 |
| 1 day irradiation | 95.5 | -0.3 | 1.04 | 1.80 |
| 5 day irradiation | 95.5 | -0.6 | 1.93 | 3.22 |
| 10 day irradiation | 95.4 | -1.0 | 3.15 | 5.23 |
YI: JIS K 7373:2006 (Light source: D65, View angle: 2 degrees)
Color matching function: JIS Z 8781-1:2012 (View angle: 2 degrees, Data interval: 1 nm)
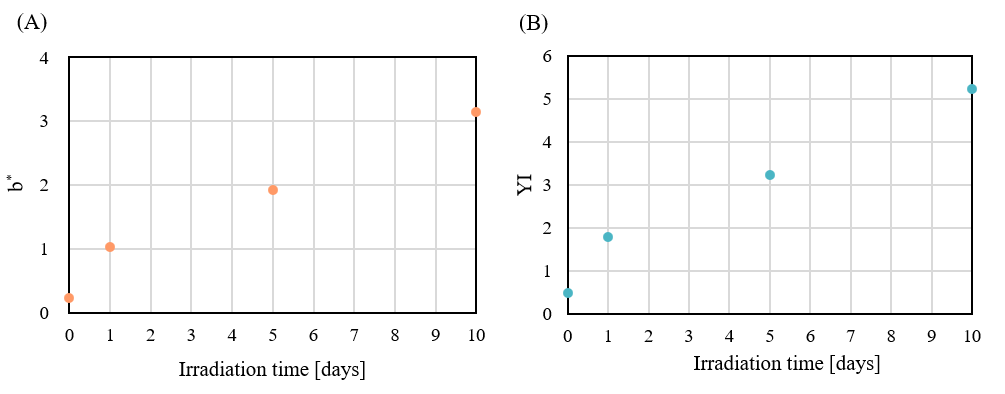
Fig. 4 Changes in b* and YI with irradiation time
(A) : b* (B) : YI
Figure 5 shows chromatograms for two PMMA samples (standard sample 1 and 2), and Figure 6 shows the resulting calibration curve.
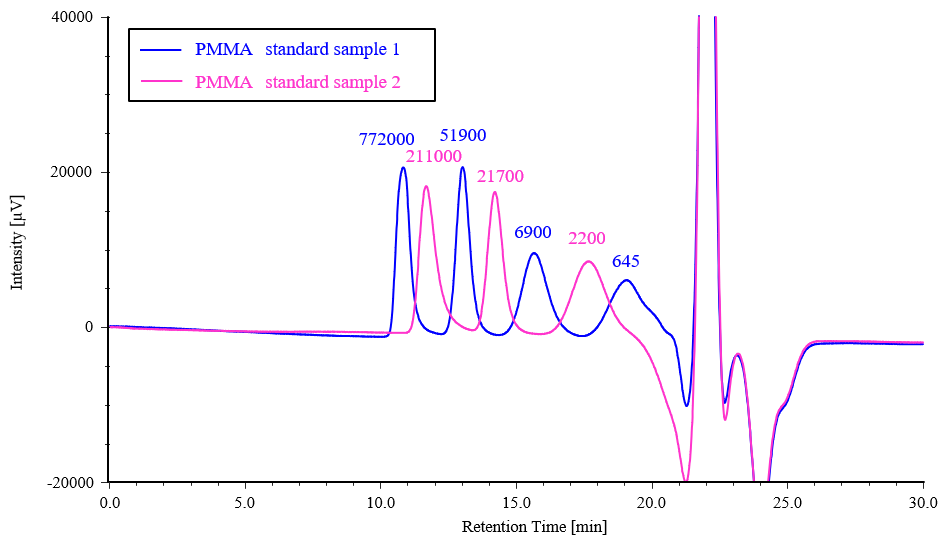
Fig. 5 Chromatograms for PMMA standard samples
(The number above each peak represents the corresponding peak molecular weight Mp)
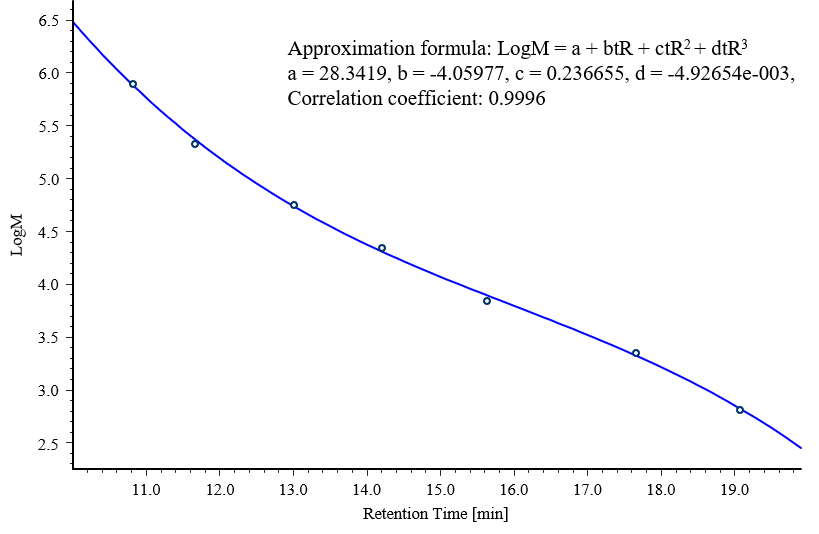
Fig. 6 Molecular weight calibration curve created using PMMA standard samples
Figure 7 shows chromatograms for the PET test samples subjected to photodegradation testing, together with that for an unirradiated sample. Figure 8 shows the corresponding differential molecular weight distribution curves, where the horizontal axis represents the logarithm of the molecular weight to make it easier to observe changes in the distribution. It can be seen that the peak tops shift towards lower molecular weight as the irradiation time increases. On the other hand, the right-hand tails of the curves shift toward higher molecular weight with increasing irradiation time.
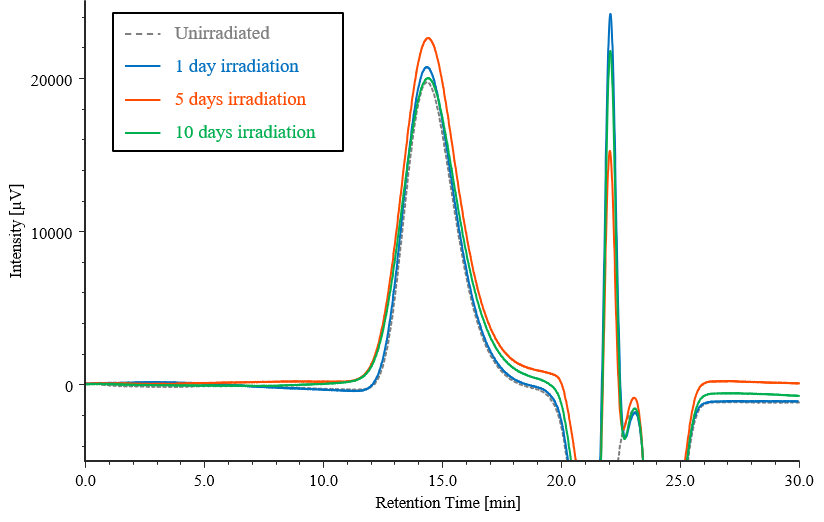
Fig. 7 Chromatograms for PET test samples
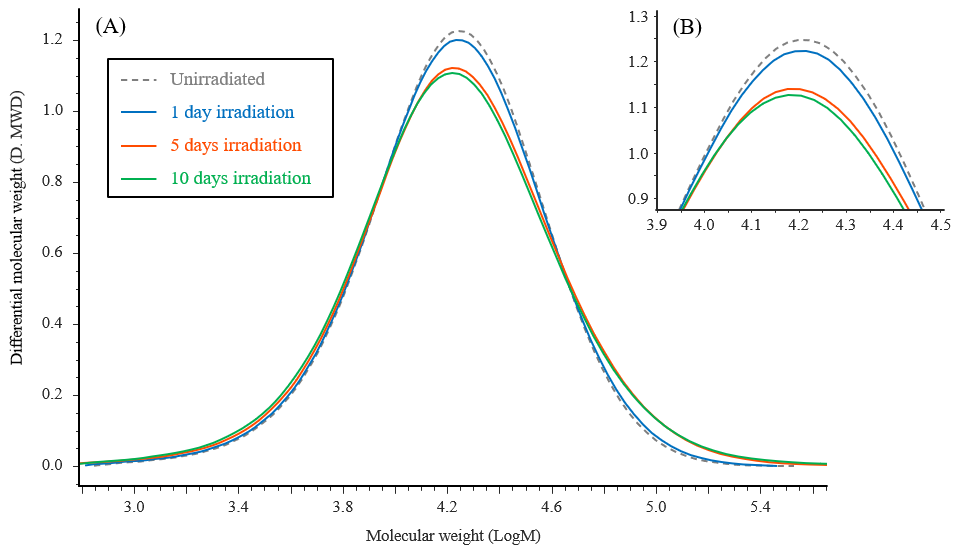
Fig. 8 Differential molecular weight distribution curves for PET test samples
(A) : Full curves (B) : Enlarged view of peak tops
Table 2 shows the PMMA-equivalent average molecular weight calculation results, and Figure 9 shows the changes in the number-average molecular weight (Mn) and weight-average molecular weight (Mw) with irradiation time. As the irradiation time is increased, Mp and Mn decrease and Mw increases. This suggests that both decomposition of the PET main chain and intermolecular crosslinking occur simultaneously under light irradiation.
Table 2 PMMA-equivalent average molecular weight calculation results
| Sample | Mp | Mn | Mw | Mw/Mn |
| Unirradiated | 18039 | 10756 | 19994 | 1.86 |
| 1 day irradiation | 17825 | 10571 | 20356 | 1.93 |
| 5 day irradiation | 17511 | 10136 | 22421 | 2.21 |
| 10 day irradiation | 17035 | 10028 | 23174 | 2.31 |

Fig. 9 Change in average molecular weight with irradiation time
(A) : Number-average molecular weight (Mn) (B) : Weight-average molecular weight (Mw)
Conclusion
In this study, we investigated the degree of photodegradation of PET test samples irradiated in a xenon accelerated weathering tester. The color of the samples was then determined using a UV-Vis spectrophotometer, and their molecular weight distribution was determined using a semi-micro scale GPC system. The UV-Vis results indicated a color change from transparent to yellow with increasing irradiation time. The GPC results for the molecular weight distributions revealed decreases in Mp and Mn, along with an increase in Mw with increasing irradiation time. This suggest that both main-chain decomposition and intermolecular cross-linking of the PET occurred due to light irradiation. These measurements can be utilized for the quantitative evaluation of polymer degradation.
References
1) JIS K 7373, Plastics – Method for Determining Yellowness and Yellowing (2024)
2) Nagano Prefecture Industrial Technology Center Technical Report: N. Shimosato, “Study on Color Changes Due to Photodegradation of Industrial Materials”, No. 16, pp. E13–E17 (2021)
Related Posts:
 Evaluation of Degradation of POM by Molecular Weight…
 Evaluation of Degradation of PA6 by Molecular Weight…
 Monitoring of Aggregates and Degradation Products by…
 Stability Evaluation of Trastuzumab and Rituximab…
 Efficient Evaluation of Substituent Effects in…
 GPC/SEC measurement of Polystyrene Oligomers using…