Introduction
The composition and properties of naturally occurring rocks are mainly characterized by the inorganic substances incorporated during their formation. Rocks are difficult to identify by appearance alone, and an objective analysis using analytical instruments is necessary to determine their composition.
Microscopic components are localized in rocks and may be present not only on the rock surface but also within the bulk. Raman spectroscopy with confocal optics is useful for nondestructive analysis of such buried components. This report describes the results of imaging measurements of rocks using a JASCO Micro-Raman Spectrometer to visualize the distribution of components. We also report the results of a surface analysis where irregularities are observed at the microscopic level.
Experimental
From the measured Raman spectra, information on rock composition was obtained using a multivariate curve resolution (MCR) analysisa) to calculate the principal component spectra and create a color-coded chemical map.
Samples
1.Rock salt (Fig. 1):
A rock formed when salt from seawater trapped underground is concentrated and crystallized. In this experiment, pink rock salt was used.
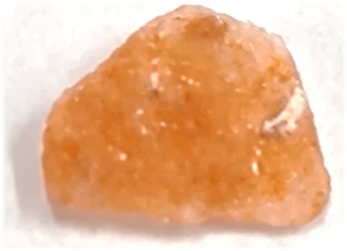
Fig. 1 Rock salt
2.Tiger’s eye (Fig. 2):
A mixture of limonite, which is an oxide of crocidolite fibers (a type of asbestos, containing Fe2+ and Fe3+), and quartz.
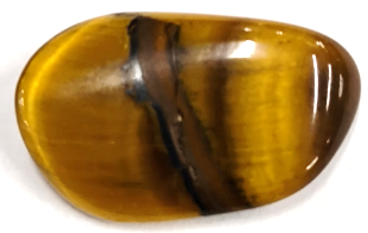
Fig. 2 Tiger’s eye
System
Instrument: NRS-5500 Micro-Raman Spectrometer
Parameters
1.Rock salt
Surface-scan imaging (SSI)b), which is useful for samples with uneven surfaces and varying heights, was used.
Excitation wavelength: 532 nm
Objective lens: 100x
Measurement interval: X, Y= 0.52, 0.52 μm
Number of points: 87×71
Exposure time: 6 sec
Accumulations: 1
2.Tiger’s eye
A Raman imaging analysis was performed on limonite fibers embedded in the near-surface region of the sample.
Excitation wavelength: 532 nm
Objective lens: 100x
Measurement interval: X, Y= 0.32, 0.32 μm
Number of points: 34×60
Exposure time: 0.15 sec
Accumulations: 1
Keywords
Rock, mineral, inorganic compound, component analysis, imaging, nondestructive analysis, surface analysis, Raman spectroscopy
Results
1.Rock salt
The principal component spectra calculated by MCR are shown in Fig. 3.
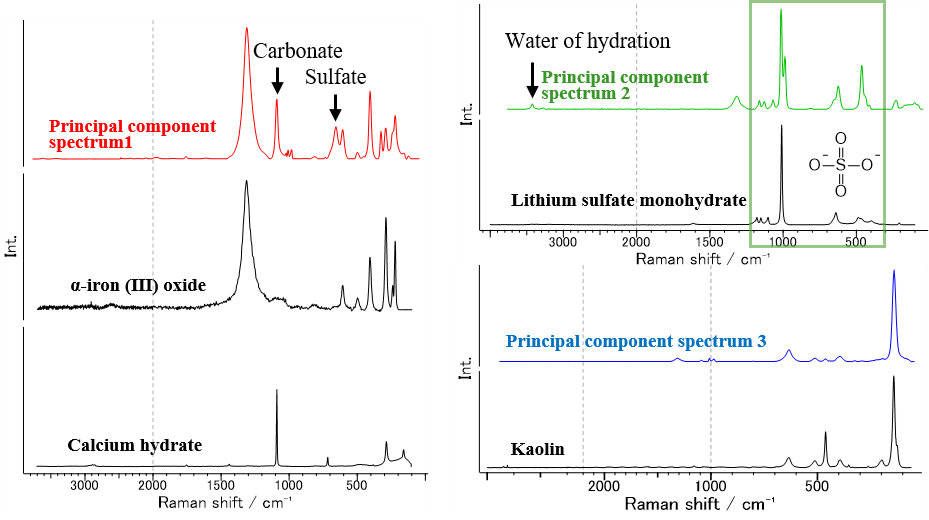
Fig. 3 Principal component spectra for rock salt and database search results
Following a database search, principal component spectrum 1 was identified as α-iron (III) oxide (α-Fe2O3), which is thought to be responsible for the red color of the rock salt. For bands not assigned to α-Fe2O3, that near 1090 cm-1 was probably due to carbonates such as calcium carbonate, and that near 660 cm-1 was consistent with the sulfate band obtained by a database search for principal component spectrum 2.
There were bands assigned to sulfate ions (SO42-) in principal component spectrum 2. Accordingly, many sulfates were ranked high in the database search. The spectrum of lithium sulfate monohydrate (Li2SO4×H2O) is shown in Fig. 3 as a representative example. The band at around 3400 cm-1 is considered to be associated with water of hydration. The above results indicate that sulfate and metal ions contained in seawater formed sulfate hydrates.
Principal component spectrum 3 was consistent with the spectrum of kaolin (Al4Si4O10(OH)8), which is found in many rocks and is produced by weathering of feldspar. The rock salt was found to contain a variety of inorganic substances commonly referred to as minerals.
Figure 4 shows an all-in-focus image and a color-coded chemical map of the distribution of components. The black areas appear to be sodium chloride, the main component of rock salt, which is not observed by Raman spectroscopy. The MCR analysis results highlighted differences in the rock-salt surface composition that are not apparent in the observation image.
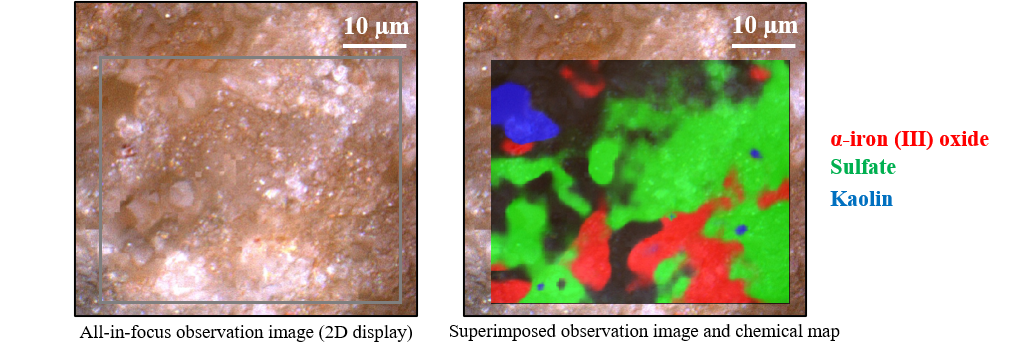
Fig. 4 Imaging analysis results for rock salt
2.Tiger’s eye
Figure 5 shows the principal component spectra calculated by MCR and the database search results. Principal component spectra 1 and 2 are considered to be associated with iron (III) α-oxyhydroxide (α-FeO(OH)) and quartz (SiO2), respectively.
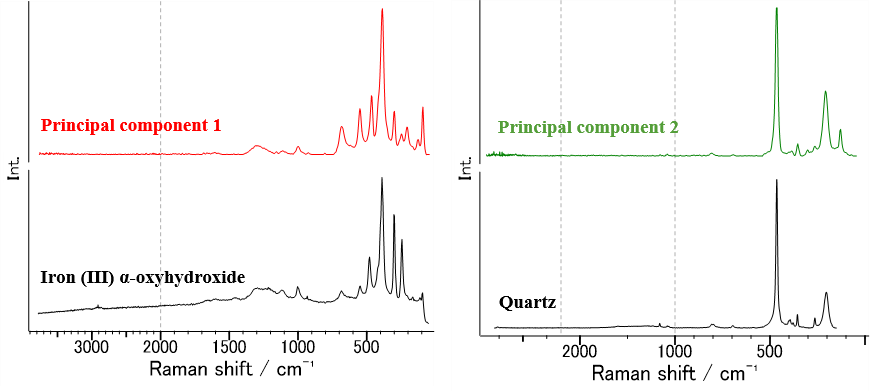
Fig. 5 Principal component spectra for tiger’s eye and database search results
Figure 6 shows a microscopic observation image and a chemical map of the distribution of components. Based on the chemical map, the yellowish-brown color of the fibers in the observation image is attributed to α-FeO(OH), which is the main component of the limonite contained in tiger’s eye. The MCR analysis results thus indicate that crocidolite fibers embedded in quartz were oxidized to form limonite.
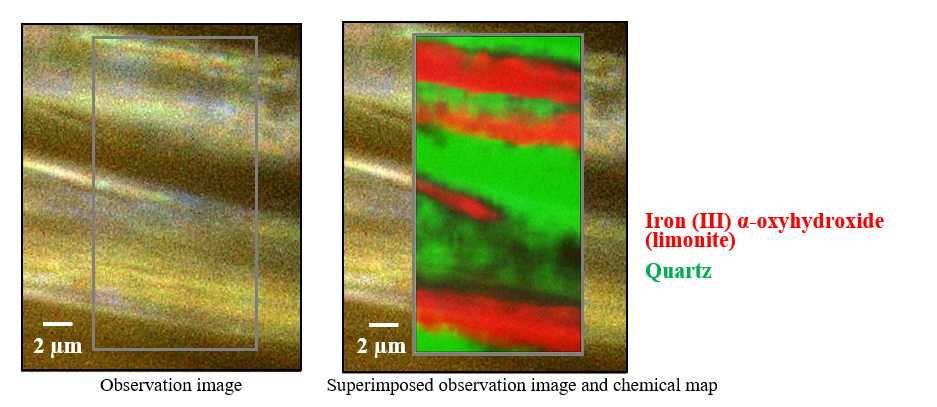
Fig. 6 Imaging analysis results for tiger’s eye
Conclusion
Imaging measurements using the JASCO micro-Raman spectrometer enabled visual determination of surface and buried components in small localized regions of rocks. The results show that this method can be applied to many inorganic materials including minerals because it allows analysis of small buried components and detailed component distributions without the need for sample preparation.


