Introduction
Spider silk is a remarkable protein material with tensile strength greater than steel while at the same time being more ductile than nylon. Spider silk is attracting attention as a source of next-generation materials. It exhibits partial crystalline properties where the protein molecules are oriented parallel to the fiber axis during self-assembly. The aggregation of certain amino acid residues in the silk dictate the elasticity and strength of the material; as a result there are various types of spider silk. A typical orb web (Fig. 1) is composed of three fibers with different physical properties – dragline, radial line and spiral line. In this application, we will demonstrate the structural analysis of spider silk proteins by polarized Raman micro-spectroscopy.
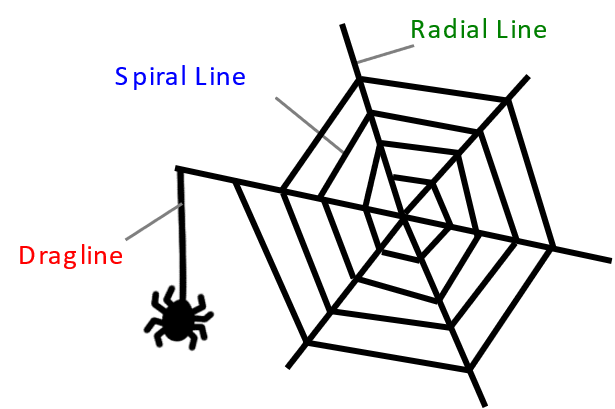
Figure 1 Example of spider silks
Raman Spectrometer NRS-5500
Experimental
Raman spectra were measured for each of three types of spider silks (dragline, radial line, and spiral line) with diameters of several μm, these were sourced from the oriental golden orb web spider, Nephila clavata. Measurements were performed by rotating the spider silk to align the polarization direction of the laser light with the axis parallel to, and orthogonal to the fiber axis (Raman measurement conditions, Ex: 532 nm, grating: 600 lines/mm, objective lens: 100x)
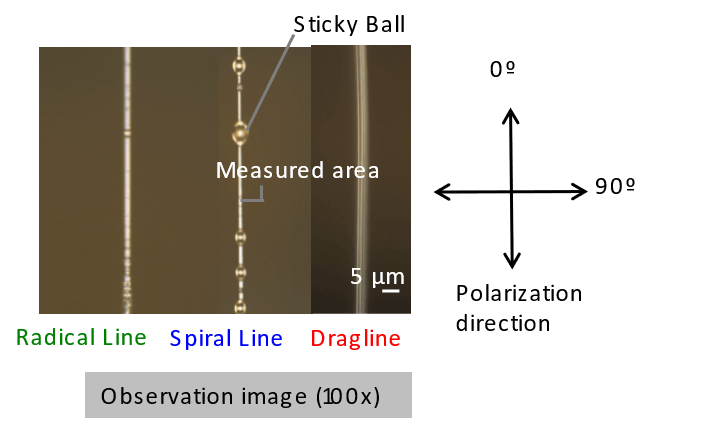
Figure 2 Definition of polarization direction
Results
As a result of polarization Raman measurement the spectra in Figure 3 were obtained. These show the differences in protein orientation, secondary structure, and amino acid composition. The amide I and amide III bands characteristic of protein peptide bonds vibrate in the direction perpendicular and parallel to the molecular axis, respectively, so that their peak intensity ratios reflect the magnitude of protein orientation. In addition, it is well known that the peak positions of amide I and amide III shift due to differences in the secondary structure of proteins1).
Analysis of the peak intensity ratio and peak position of amide I and amide III shows that the dragline and radial line proteins are largely oriented in the fiber axis direction and contain a large crystalline component with β sheet structure. This is thought to be related to the tensile strength of the spider silk in the direction of the fiber axis.
The spiral line (for catching prey) has low orientation and contains many α helices and random coil structures. This is thought to be related to the ductile and elastic properties of the spiral line fiber (Fig. 4). In addition, the spectrum of the spiral line fiber suggests that its surface has proline-rich sticky ball components attached to it.
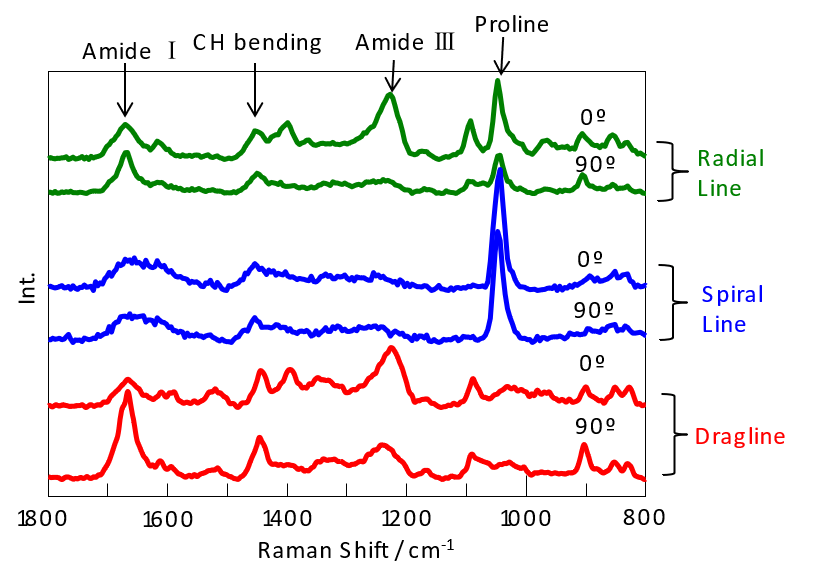
Figure 3 Raman spectra measured with polarizer
Conclusion
In this application we found that the spider Nephila clavata can produce silk fibers with different molecular structures depending its needs. Micro-Raman spectroscopy, which can measure samples with spatial resolution down to about a μm and can obtain high quality spectra containing vibration information without contact is extremely useful for structural analysis of macromolecules such as spider silk. Using polarized spectral measurement, information about structural orientation can be obtained at the same time; this makes it very effective for evaluating the orientation and composition of minute regions such as single fibers and multilayer films.
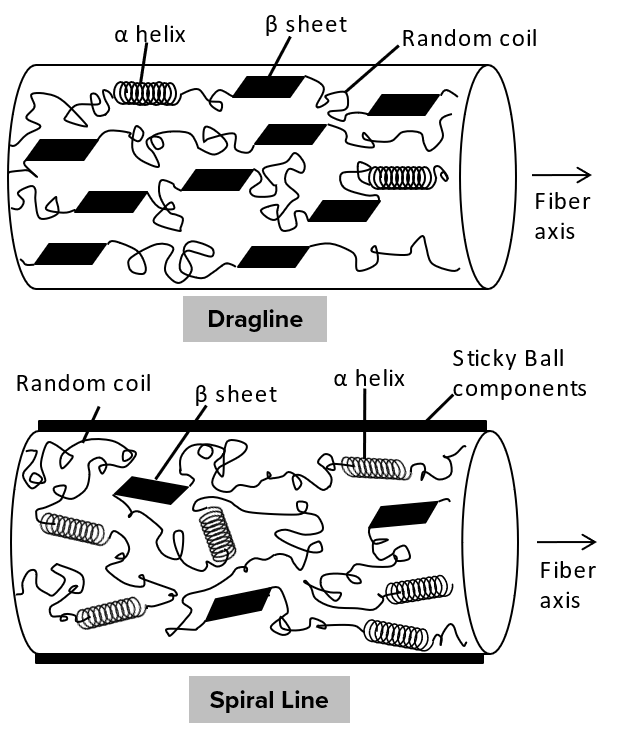
Figure 4 Image of Dragline and Spiral Line Silk Fibers
Supplement (about polarization measurement)
When evaluating orientation by polarization measurement, there are two methods: rotating the sample and rotating the plane of polarization on the optical axis.
(1) Rotating sample (method used for this application: Fig. 5)
Set the polarizer (analyzer) on the Raman optical path side in the same polarization direction as the laser light (linearly polarized), and rotate the sample. Since the polarization plane on the laser beam side is not moved, a spectrum with stable intensity can be obtained. By continuously rotating the sample, it is possible to draw a profile of peak intensity.
(2) Rotating the plane of polarization on the optical axis (Fig. 6)
The plane of polarization of the laser beam (linearly polarized) is rotated 90 degrees using a half-wave plate (HWP).
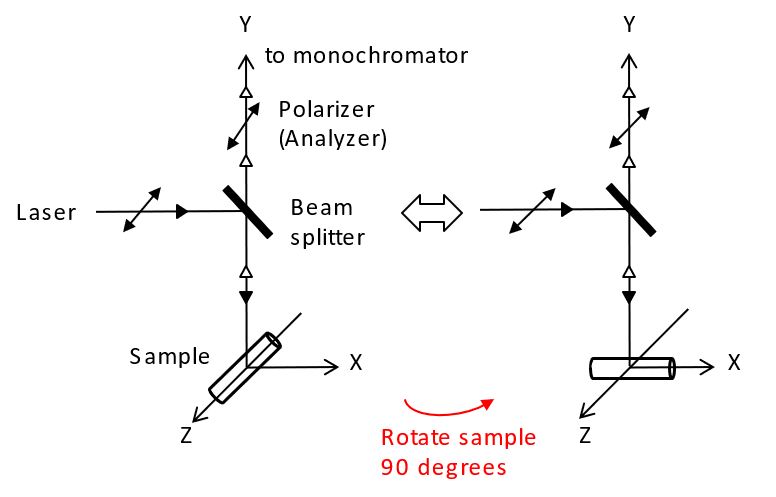
Figure 5 Rotate the sample
Simultaneously, the polarizer on the Raman optical path side is also rotated 90 degrees. The method of rotating the plane of polarization of the laser beam is affected by the polarization characteristics of each optical element in the optical path. Therefore, when considering the orientation at the peak intensity, the vertical axis must be corrected. This method is sometimes used when it is necessary to rotate the plane of polarization at the same measurement point without moving the sample.
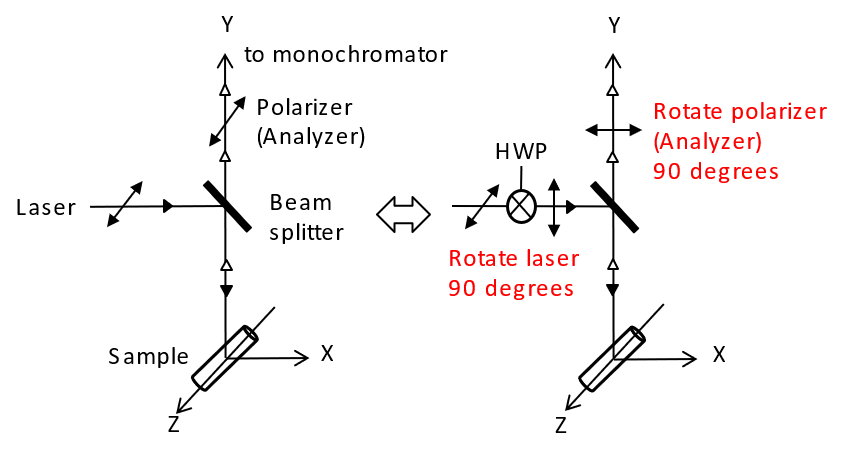
Figure 6 Rotate the plane of polarization
References
1) P.R. Carey, Biochemical Applications of Raman and Resonance Raman Spectroscopies.1982
*This application is the result of a joint research project with Prof. N. Katayama at the Graduate School of Natural Sciences, Nagoya City University.

 spectroscopy")

 properties of platinum complexes using a CPL measurement system and a spectrofluorometer")

