Analysis Wizard
The analysis wizard guides the user through a simple flowchart to optimize parameters for data processing to effortlessly generate color-coded maps based on principal component analysis.
Executing MCR calculation

Creating color-coded maps
Chemical Image
Chemical images can be visualized using a variety of display formats, including color 3D color display, color-coded mapping, and contour plots. In addition, chemical images can be seamlessly overlaid with their corresponding optical observation images.
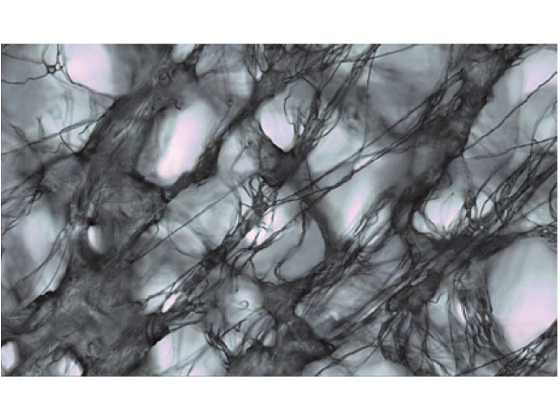
Observation image
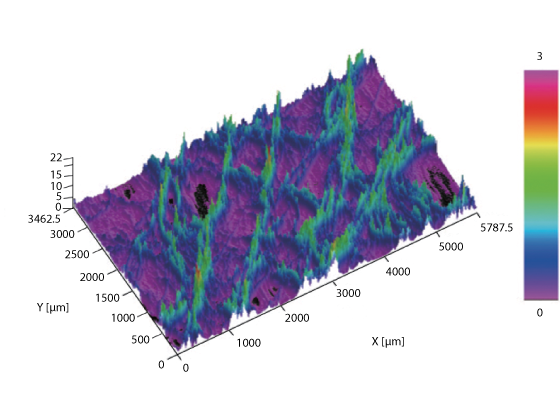
Color 3D display
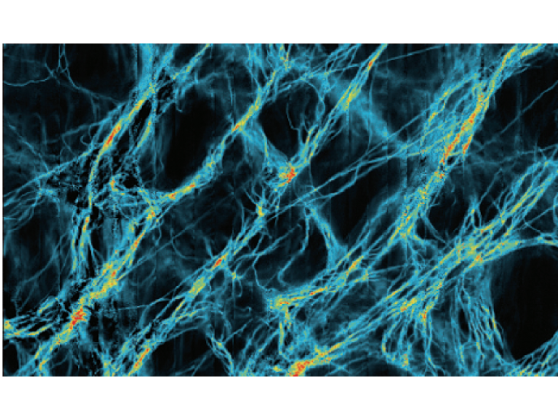
Overlay of observation image and color-coded map
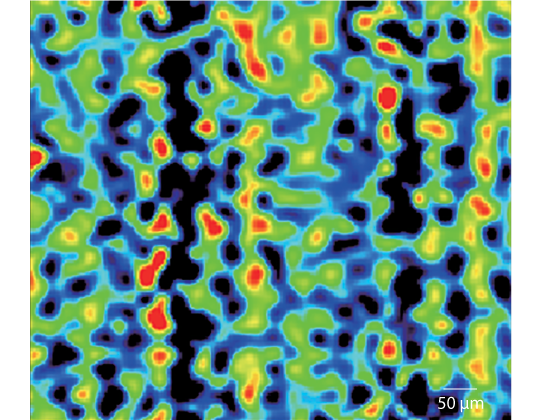
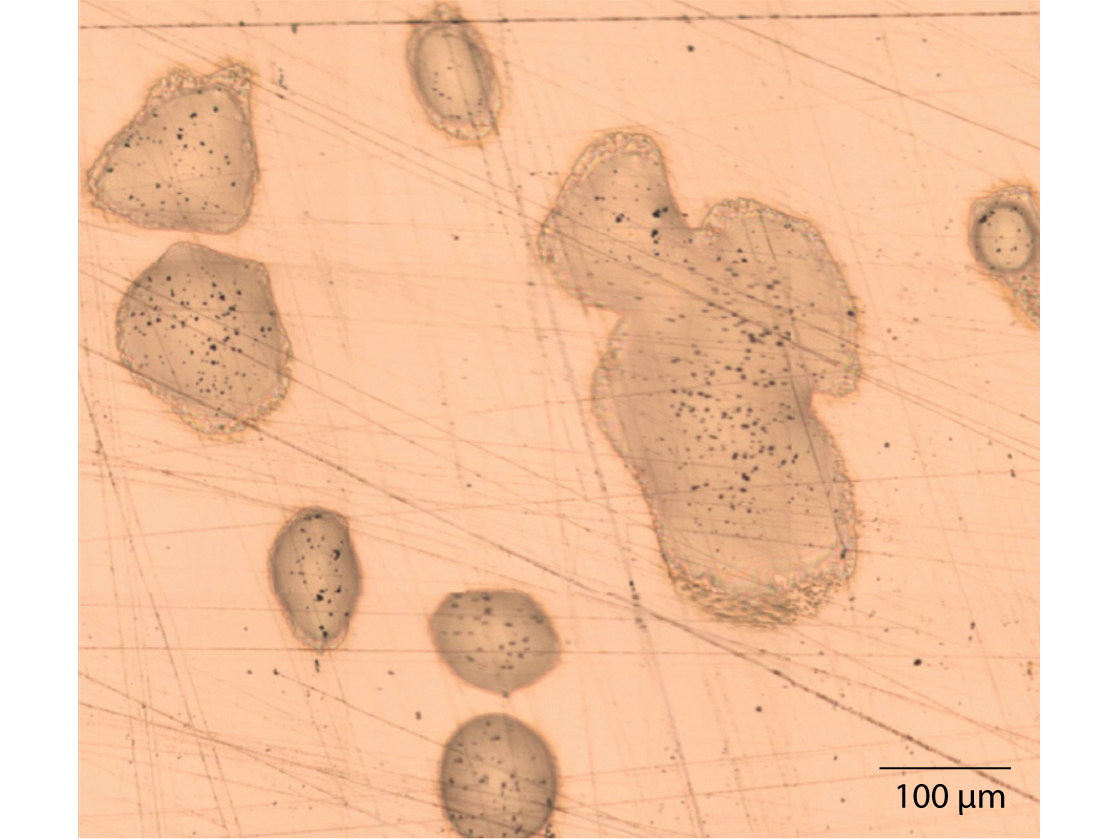
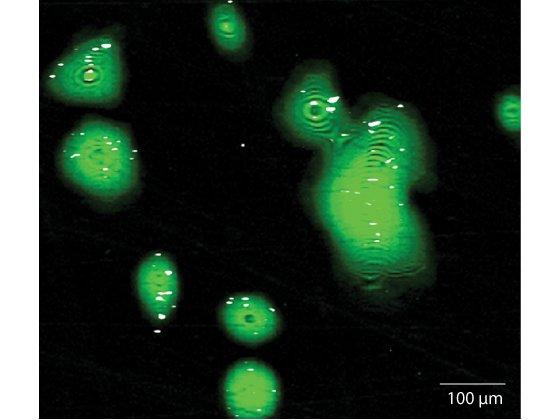
JASCO Particle Analysis
The JASCO Particle Analysis program quantifies parameters, such as particle size, area, circularity, aspect ratio, and more, for each particle using combined observation and chemical image data, enabling the generation of histograms, frequency distribution tables, correlation graphs, and component ratios.

Observation image (left) and imaging measurement results (right)
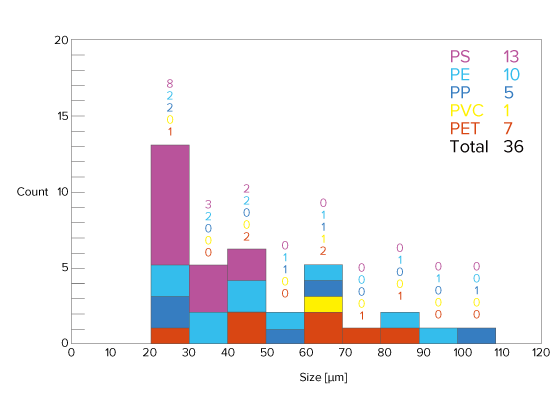
Cumulative histogram by component (horizontal axis: particle size)
Particle size analysis of microplastics
* We would like to express our sincere gratitude to TOSOH Analysis and Research Center Co., Ltd., Japan, for providing the data.
Disrelation 2D Correlation Mapping (Optional)
Developed by Dr. Hideyuki Shinzawa of the National Institute of Advanced Industrial Science and Technology (AIST), 2D Correlation Mapping is an analytical method that enables clear identification of phase boundaries associated with spectral changes. 2D Correlation Mapping allows areas exhibiting significant changes in crystallinity, molecular orientation, or hydrogen bonding to be be readily visualized and distinguished.

Observation image
Imaging measurement results – peak height ratio – (crystallinity)

2D correlation mapping calculation results (crystallinity variation)
Evaluation of crystallinity distribution in uniaxially oriented polypropylene film – microscopic transmission method –
Enhancement of Analysis Accuracy with IQ Frame (Optional)
The combination of the autostage and IQ Frame allows to measure in the same location on a sample seamlessly by infrared microscope, Raman microscope, and UV-VIS/NIR microscopic spectrophotometers. Since infrared spectroscopy and Raman spectroscopy are particularly complementary, obtaining both spectra enhances the accuracy of analysis.

Combined Analysis Using Infrared and Raman Microscopes
The combination of infrared and Raman spectroscopy provides a richer and more comprehensive molecular characterization from a single sample, resulting in highly reliable analytical results. IQ Frame ensures perfect alignment between infrared and Raman measurements, eliminating positional differences and enabling fast, accurate acquisition of complementary data.
Observation image

Infrared imaging measurement results (red: epoxy resin, yellow: glycol)
Raman imaging measurement results (green: epoxy resin, white: titanium oxide)
Foreign material measurement on metal plates