Introduction
Polyurethanes have excellent tensile strength, abrasion and oil resistance, and are found in numerous consumer products, including paints, adhesives, sponges, fibers, leathers and car upholstery. These polymers are manufactured by the polymerization reaction (polyaddition) of a polyol, which has hydroxyl groups, with an isocyanate (Figure 1). Since the number of reactive hydroxyl groups in a polyol that is polymerized in the presence of isocyanate directly influences the number of urethane linkages, it considerably impacts the physical properties of the polyurethane product. Traditionally, the hydroxyl value* has been used to determine the number of hydroxyl groups, and measuring and controlling this value ensures proper production of polyurethane.
The JIS K 1557-1 standard ( related with ISO 15063) specifies an indirect method for determining the hydroxyl value for polyols, based on titration of residual reagents that were not consumed in the titration reaction for acetylation or phthalation of hydroxyl groups of polyols (hereafter referred to as the standard method). However, this wet-chemistry method requires several reagents for titration and is time consuming. Recently, Fourier transform near-infrared (FT-NIR) spectroscopy has been used to determine the hydroxyl value for various materials based on JIS K 1557-6, allowing rapid measurements to be performed. Although it is necessary to determine the hydroxyl value using the standard method in advance, by creating a calibration curve that shows the correlation between the hydroxyl values obtained by the standard method and the FT-NIR method, the value for a small amount of sample can be easily determined in a short time, and unlike the standard method, no reagents other than the sample need to be prepared. In this application note, we describe a measurement example compliant with JIS K 1557-6 for analyzing a variety of hydroxyl values using the JASCO FT-IR spectrometer and a multivariate statistical analysis technique, the partial least squares (PLS) model.
*The number of milligrams of potassium hydroxide (KOH) required to neutralize one gram of the sample is called the hydroxyl value.
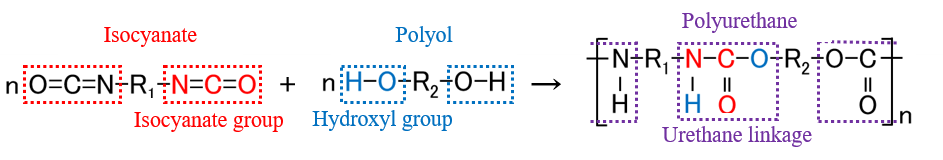
Fig. 1 Example of polyurethane synthesis
Experimental
Sample
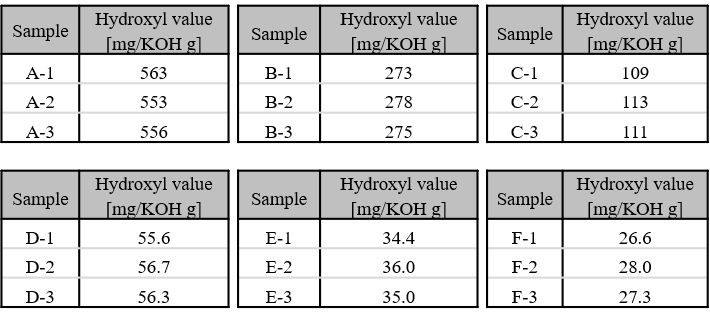
Polyoxypropylene glycol (hydroxyl value: 27.3 mg KOH/g to 563 mg KOH/g)
Table 1 Hydroxyl value for each sample per hydroxyl value
System
Instrument: FT/IR-6X FT-IR spectrometer
Accessory: Air-cooled Peltier-element holder (customized-ordered) and sampling test tubes
Program: PLS-4X PLS Quantitative analysis program
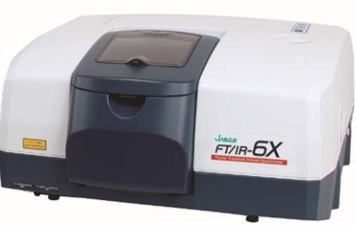
Fig. 2 FT/IR-6X Spectrometer
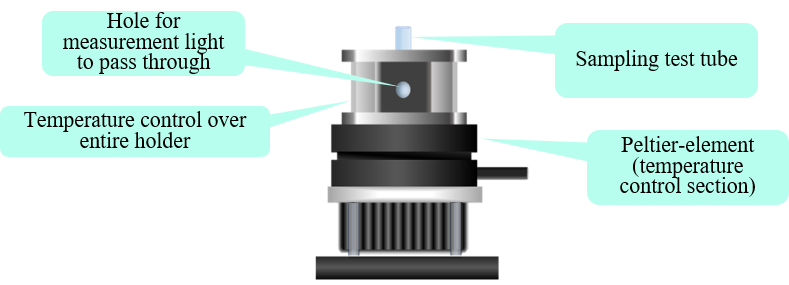
Fig. 3 Measurement system (Features of air-cooled Peltier-element holder (side view))
Parameters
Resolution: 8 cm-1
Accumulations: 16 (approx. 10 sec)
Beam splitter: Broadband KBr
Detector: InGaAs
The near-infrared spectrum of polyols is affected by the sample temperature at the time of measurement. To reduce this dependence, the sample was heated to 70 °C in an incubator before measurement, and then transferred to the test tube using a Pasteur pipette. The sample was allowed to stabilize for two minutes in the Peltier holder, while maintaining a temperature of 70 °C, and the sample spectrum was then measured. The Peltier holder allows the temperature of multiple tubes to be stabilized while waiting for the next measurement to begin.
Keywords
Hydroxyl value, polyol, polyurethane, near-infrared spectroscopy, multivariate statistical analysis, PLS model, JIS K 1557-6, ISO 15063
Results
Near IR spectrum
Figure 4 shows the NIR spectra for the sample and the calculation ranges used for creating a PLS calibration curve. The combination band at 4348 cm-1 to 5000 cm-1 associated with R-OH functional groups, and the band at 6666 cm-1 to 7246 cm-1 associated with the first R-OH overtone, as described in JIS K 1557-6, were used for the calculation.
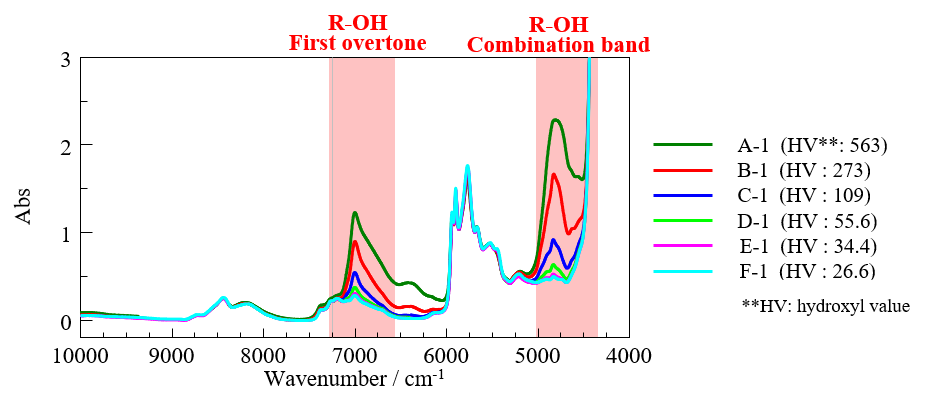
Fig. 4 Measured spectra (one representative spectrum for each concentration group in Table 1)
PLS calibration curve
Each sample was measured two times and a PLS calibration curve was created (Figure 5). The calibration curve yielded a high correlation coefficient of 0.9999. The PLS method could capture the changes in the broad absorption band in the near-infrared region, indicating that a calibration curve can be created to accurately quantify the hydroxyl value for polyols.
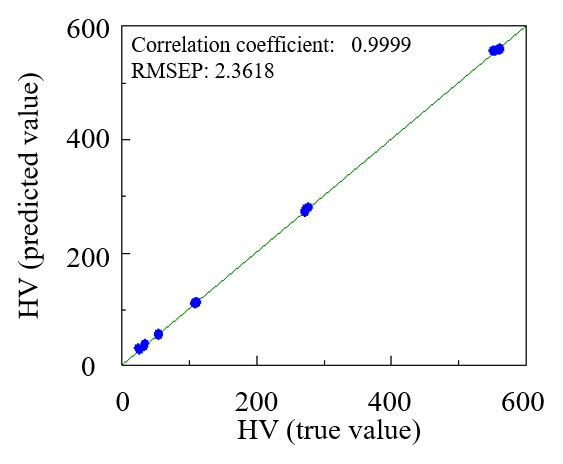
Fig. 5 PLS calibration curve for HV
Closs-validation
Next, a PLS calibration model was created using the spectra, excluding a specified spectrum. The excluded spectrum was then used to calculate the quantified value. This calculated value was compared with the true value through cross-validation. Table 2 shows some of cross-validation results, demonstrating that calibration model achieved good quantitation accuracy.
| Sample | True value | Quantitation value | Percentage error (%) |
| A-2 (1st measurement) | 553 | 554.5 | 0.27 |
| A-2 (2nd measurement) | 553 | 556.6 | 0.65 |
| B-1 (1st measurement) | 273 | 270.8 | 0.81 |
| B-1 (2nd measurement) | 273 | 274.3 | 0.48 |
| D-2 (1st measurement) | 56.7 | 56.0 | 1.23 |
| D-2 (2nd measurement | 56.7 | 56.2 | 0.88 |
Conclusion
It was shown that the hydroxyl value for polyols could be accurately determined using a combination of near-infrared spectroscopy and multivariate analysis (PLS). The measurements could be performed for small sample volumes in a short time, in accordance with JIS K 1557-6. This is a powerful approach to quality control, quality testing and production process control environments for pharmaceuticals and food products, and not only for polymers.
