Introduction
Evaluation of protein structure is significant for exploring protein functions in human body as well as developing antibody drugs. Proteins are intrinsically fluorescent when excited with ultraviolet light, which is due to the aromatic amino acids (tryptophan, tyrosine, and phenylalanine) that make up the protein. Among them, tryptophan is known to exhibit the strongest emission and be sensitive to the changes in its local environment and solvent polarity1). It exhibits an excitation maximum around 280 nm and has an emission peak near 350 nm in aqueous solution. Protein surface is generally covered by hydrophilic residues in aqueous solution, and hydrophobic residues including tryptophan are placed inside of the protein structure. However, when proteins are denatured, tryptophane residues are exposed to the external hydrophilic environment, resulting in the emission peak shift to a longer wavelength2). This phenomenon is used to evaluate protein folding/unfolding due to denaturant and temperature and interactions with other molecules by measuring the fluorescence emitted by the protein1).
This paper describes the evaluation of the denaturation temperature by monitoring the conformational change of lysozyme with tryptophan residues due to temperature.
Experimental
Measurement system
FP-8550 Spectrofluorometer
ETC-115 Peltier-thermo Cell Holder
FWTS-172 Temperature Interval Scan Measurement Program
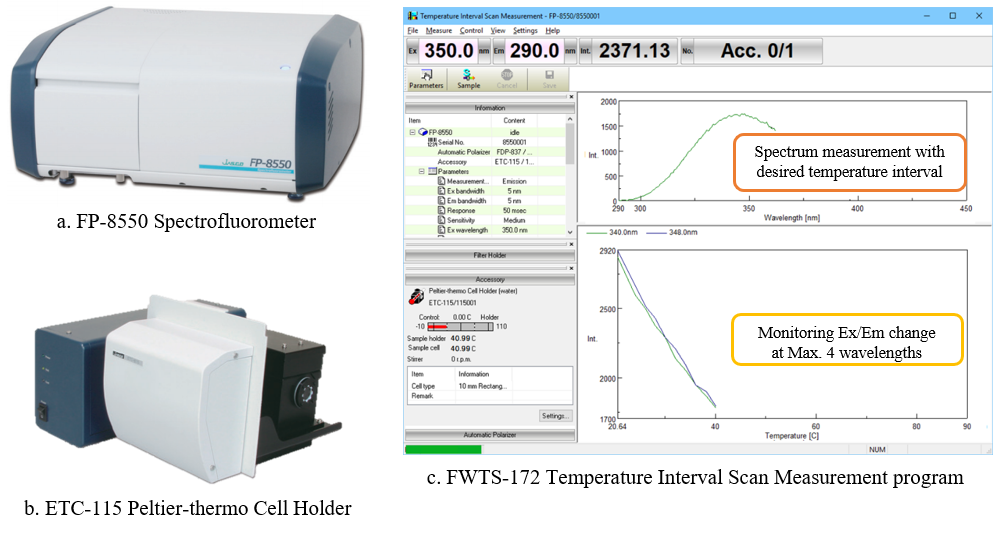
Fig. 1 Measurement system
Experimental
0.1 mg/mL lysozyme was prepared in water.
| Measurement Conditions | |||
| Excitation bandwidth | 2.5 nm | Excitation wavelength | 280 nm |
| Emission bandwidth | 5 nm | Wavelength range | 290 – 450 nm |
| Response | 0.5 sec | Data interval | 0.2 nm |
| Sensitivity | Medium | Scan speed | 200 nm/min |
| Start temperature | 15 ºC | Temperature interval | 5 ºC |
| End temperature | 90 ºC | Temperature gradient | 1 ºC/min |
- The sample was stirred during the measurement to make temperature distribution uniform in the cuvette.
- The spectra were measured 60 seconds after reaching the set temperature.
Keywords
Fluorescence, protein, denaturation, unfolding, aromatic amino acid, tryptophan, lysozyme, temperature interval measurement
Results
The fluorescence spectra of lysozyme were measured while the temperature was changing from 15 ºC to 90 ºC (Fig. 2a). The ratio of the fluorescence intensities at 340 and 350 nm was plotted in Figure. 2b, showing that the peak wavelength shifted from 340 nm to 350 nm as the temperature rises, and the fluorescence intensity ratio changed significantly at around 70 ºC. This indicates that the sample was denatured due to the temperature increase and the tryptophane residues were exposed to the solvent. The denaturation temperature was also estimated to be near 70 ºC.
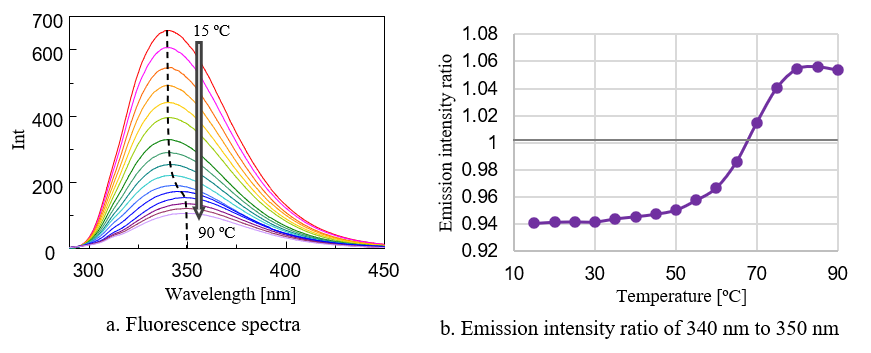
Fig. 2 Measurement results
Conclusion
This system allows the evaluation of protein unfolding and the estimation of denaturation temperature automatically. The study shown here can also be applied to the evaluation of thermal stability of modified proteins and the evaluation of protein manufacturing process and storage environment. It is also possible to evaluate protein-protein interactions by measuring changes in denaturation temperature due to binding of proteins and ligands.
References
1) Vivian, J. T., Callis, P. R., Turnbull, J. E., Lian, L., Yu, L., Biophysical journal, 2001, 80(5), 2093-2109.
2) Sindrewicz, P., Li, X., Yates, E.A., Scientific reports, 2019, 9, 11951.