Introduction
The analysis of polymers is important from the perspectives of materials science and polymer chemistry. Infrared (IR) and Raman spectroscopies are widely used to evaluate sample orientation and to perform qualitative analysis of incorporated pigments. In addition to vibrational spectroscopy, color evaluation is also conducted using ultraviolet/visible/near infrared (UV/Vis/NIR) spectroscopy. We focused on orthogonal assessment by combining these methods to enable multifaceted analysis of polymers such as fabrics.
In this poster, orthogonal assessment of polymer using multiple spectroscopic microscopes and collaboration of polarized visible light observation with IR microscopy are introduced, highlighting their complementary capabilities in polymer analysis.
Shared Sample Holder for Seamless Orthogonal Assessment Using Spectroscopic Microscopes : ‘IQ Frame’
Orthogonal assessment has been proven to be useful. However, it has been a challenge to accurately synchronize the measurement position at the microscopic level across different systems, such as Raman, IR and/or UV/Vis/NIR microscopes. To overcome this barrier, we have developed ‘IQ Frame’, a sample holder that can be easily transferred between Raman, FT-IR and UV/Vis/NIR microscopes.

Features of IQ Frame
- Shared sample holder for orthogonal assessment using multiple spectroscopic microscopes
- Exact position matching is performed using the following two criteria; Firstly, measurement coordinates stored in the spectrum data file are used to roughly set the measurement position. Secondly, by comparing the image acquired with the previous measurement with the live visible image, fine adjustment can be made to the stage until the sample is perfectly matched.
Application Using IQ Frame
Orthogonal Assessment of Micro Fabrics Using UV/Vis/NIR, Raman and FT-IR Microscope
Sample:
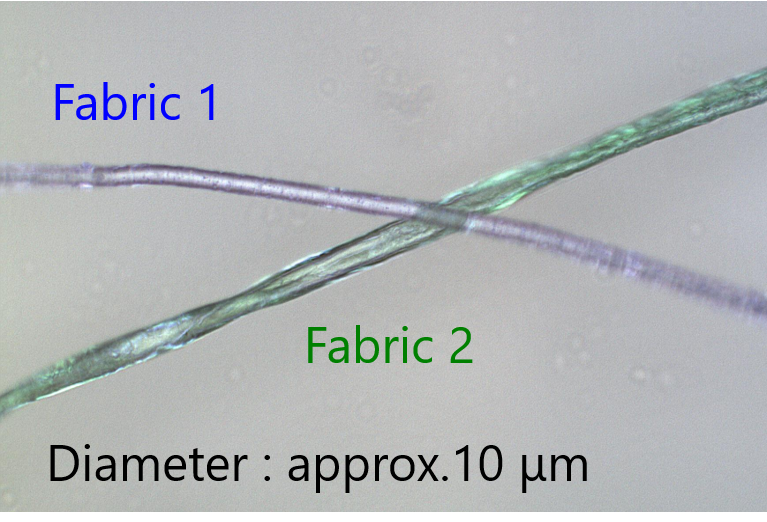
Colored fabrics (green, blue)
Method:
Using IQ Frame, measure identical positions of each fabric using UV/Vis/NIR, Raman and FT-IR spectrometers
Results:
UV/Vis/NIR: Identified the color To determine the excitation laser wavelength for resonance Raman
Raman: Identified the colorant (dye)
FT-IR: Identified the chemical composition
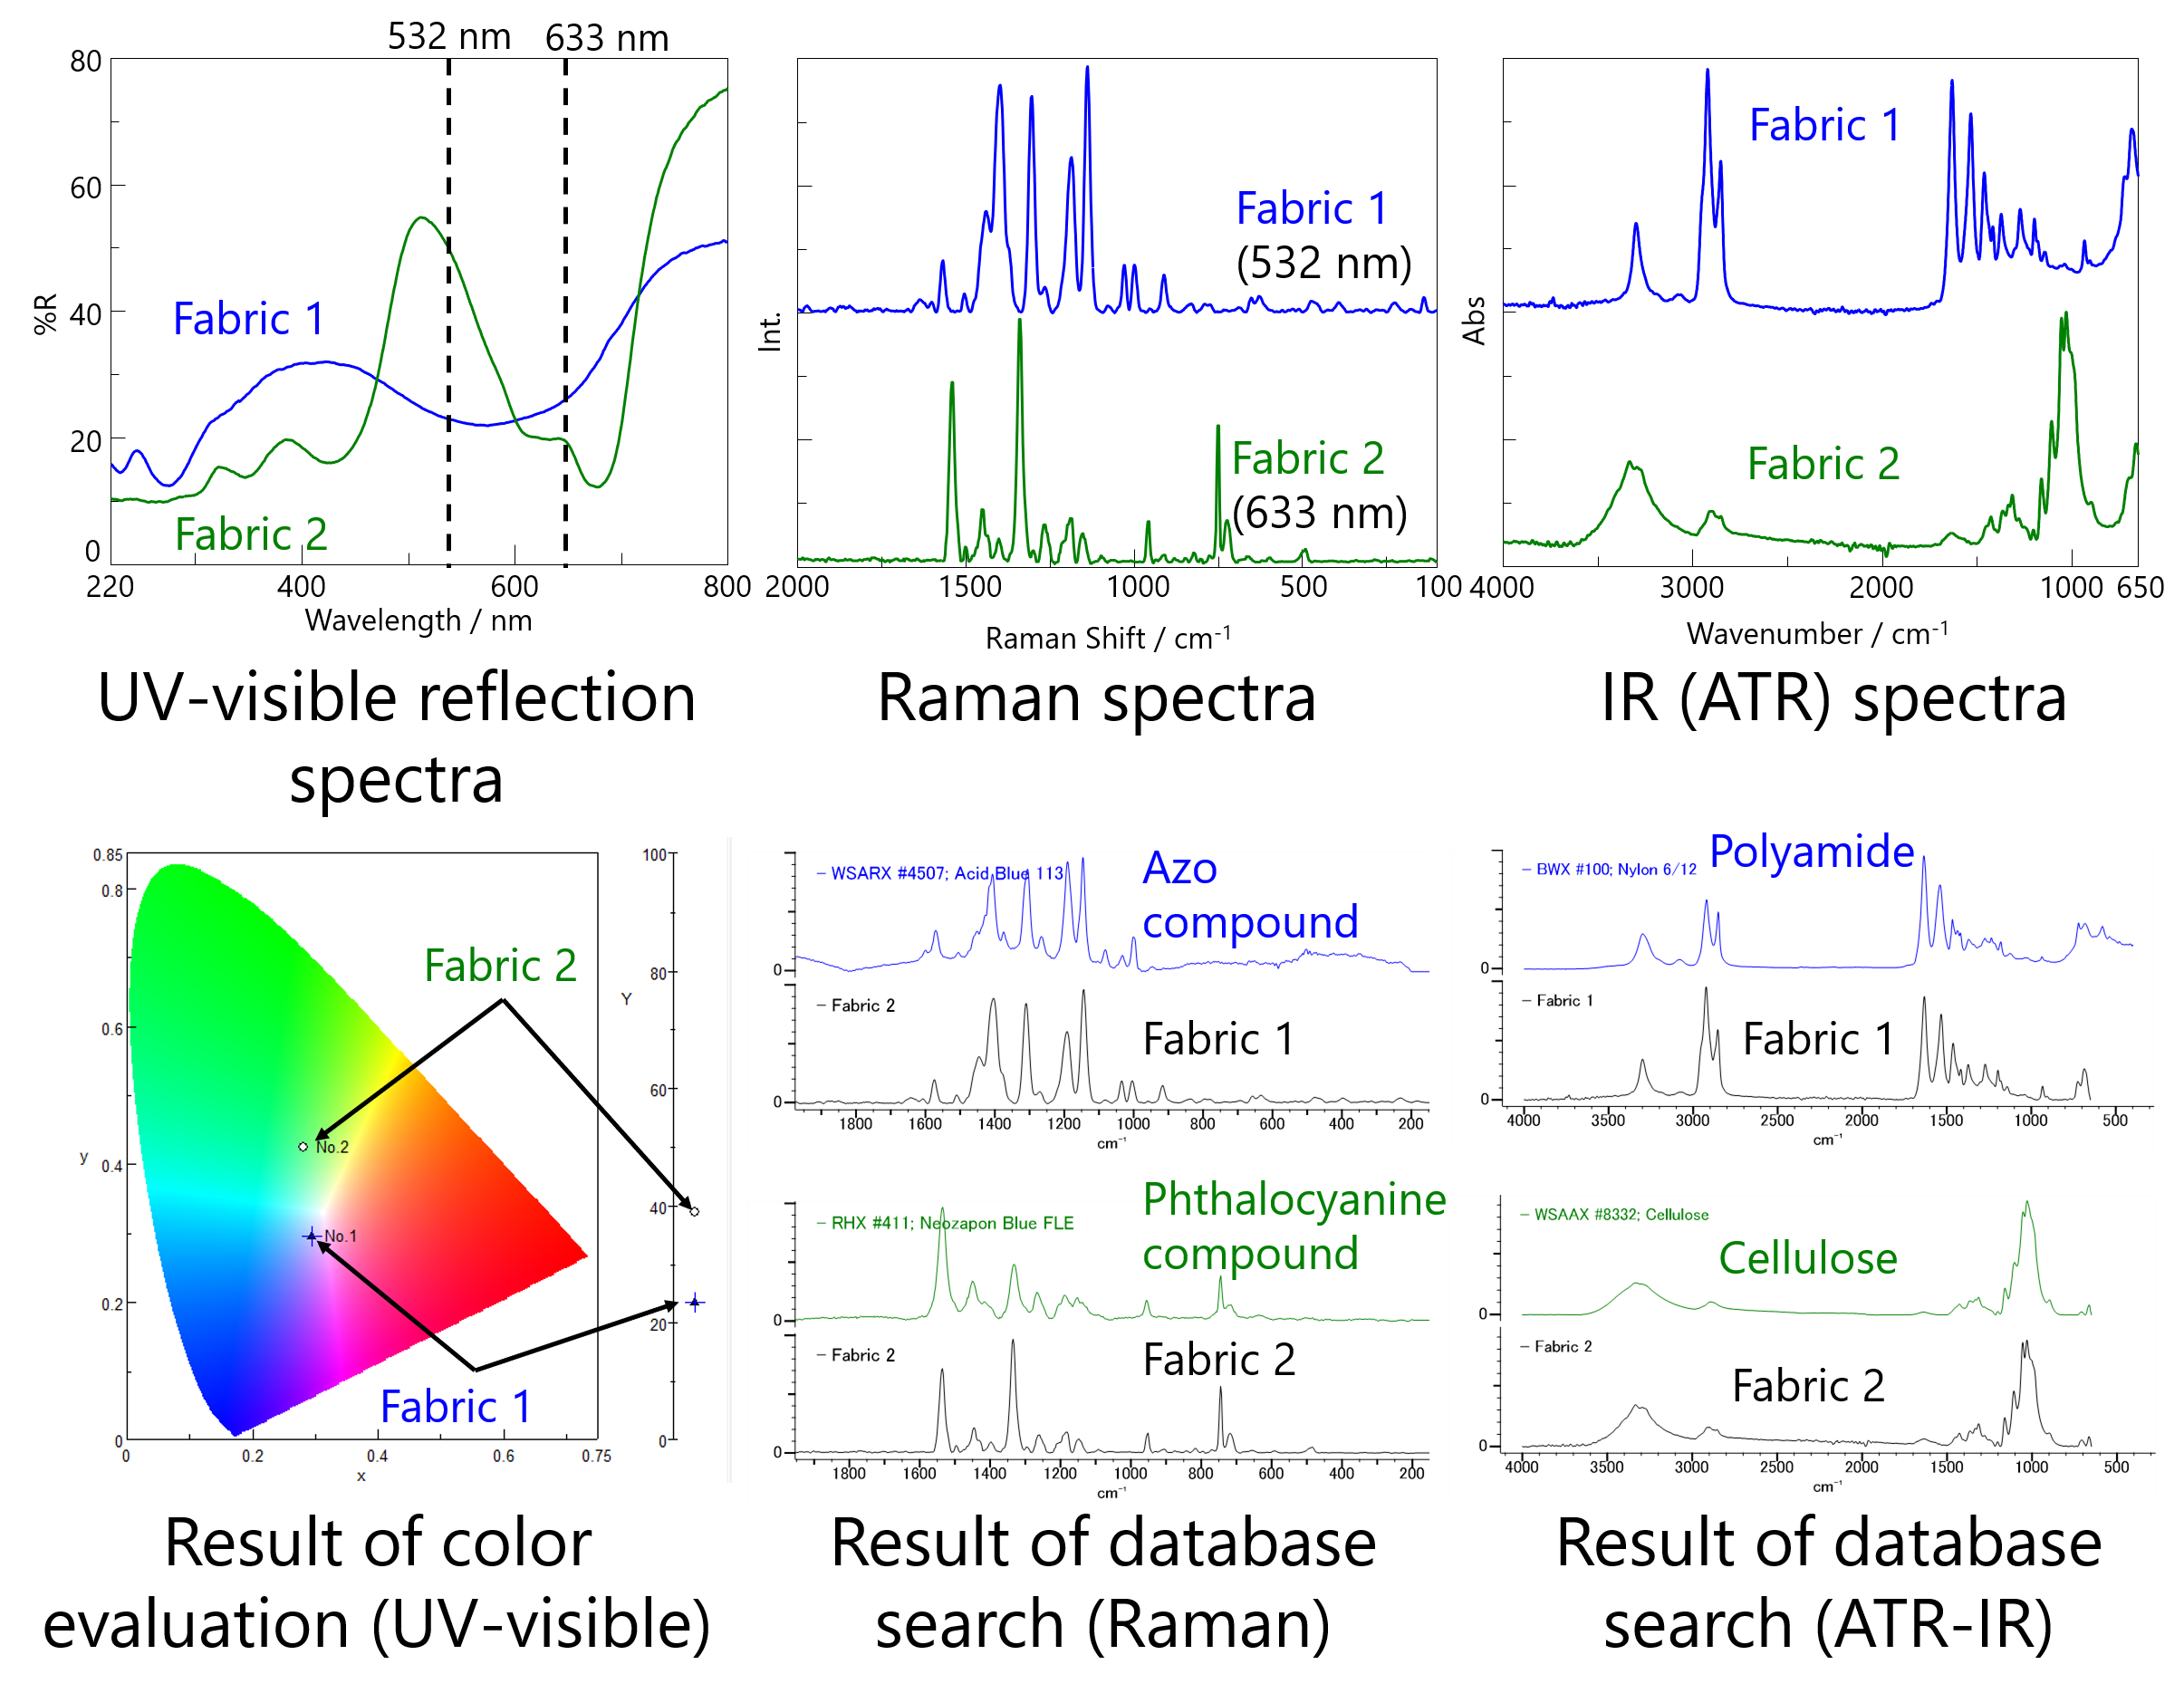
UV-visible spectra were used to analyze the fabric colors, and to determine the excitation laser wavelength for Raman measurement. For the Raman measurement of these samples, laser wavelengths close to the absorption maxima (532 nm for Fabric 1 and 633 nm for Fabric 2) were selected. From the Raman data, it was possible to identify information about the dyes using the phenomenon of resonance Raman scattering. Lastly, using FT-IR microscope with an ATR objective, the chemical composition of the fabrics could be determined.
Application Using Visible Observation and IR
Orthogonal Assessment of Multi-layer film Using Polarized Visible Observation and FT-IR Microscope
Sample:
Multi-layer polymer film (for food wrap) which was sliced into thin sections and pressed into a KBr pellet.
Method:
Visible observation: non-polarized, polarized under parallel and crossed Nicol (This system is incorporated into an FT-IR microscope.)
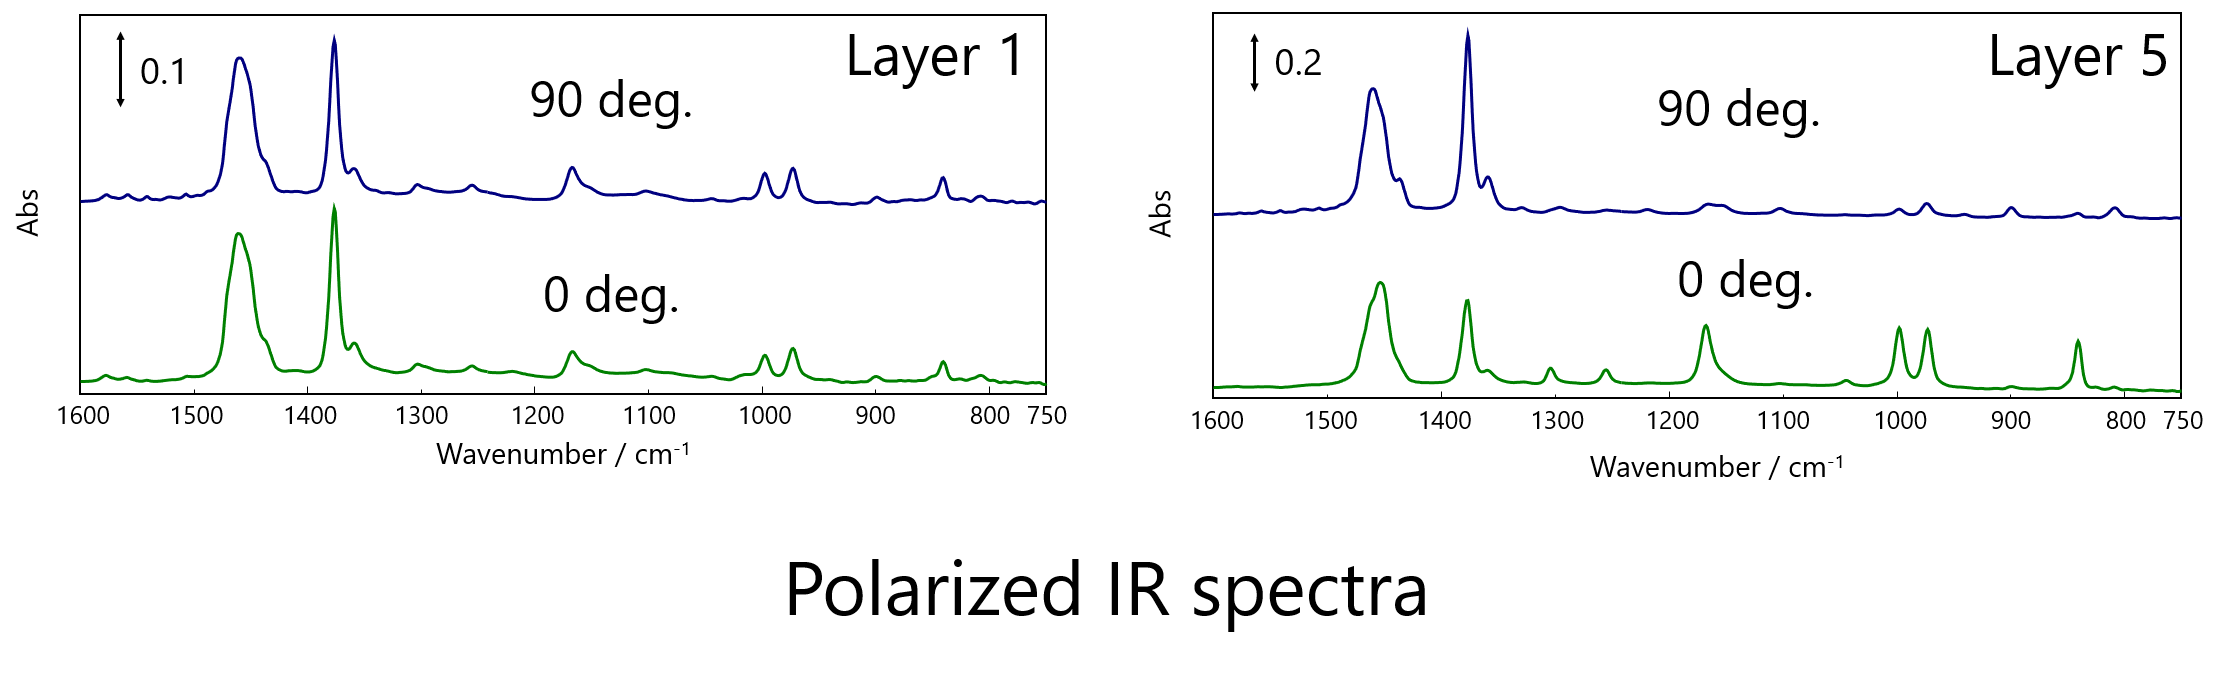
FT-IR microscope: Transmission method (4 cm-1 resolution, 10 × 70 μm aperture)
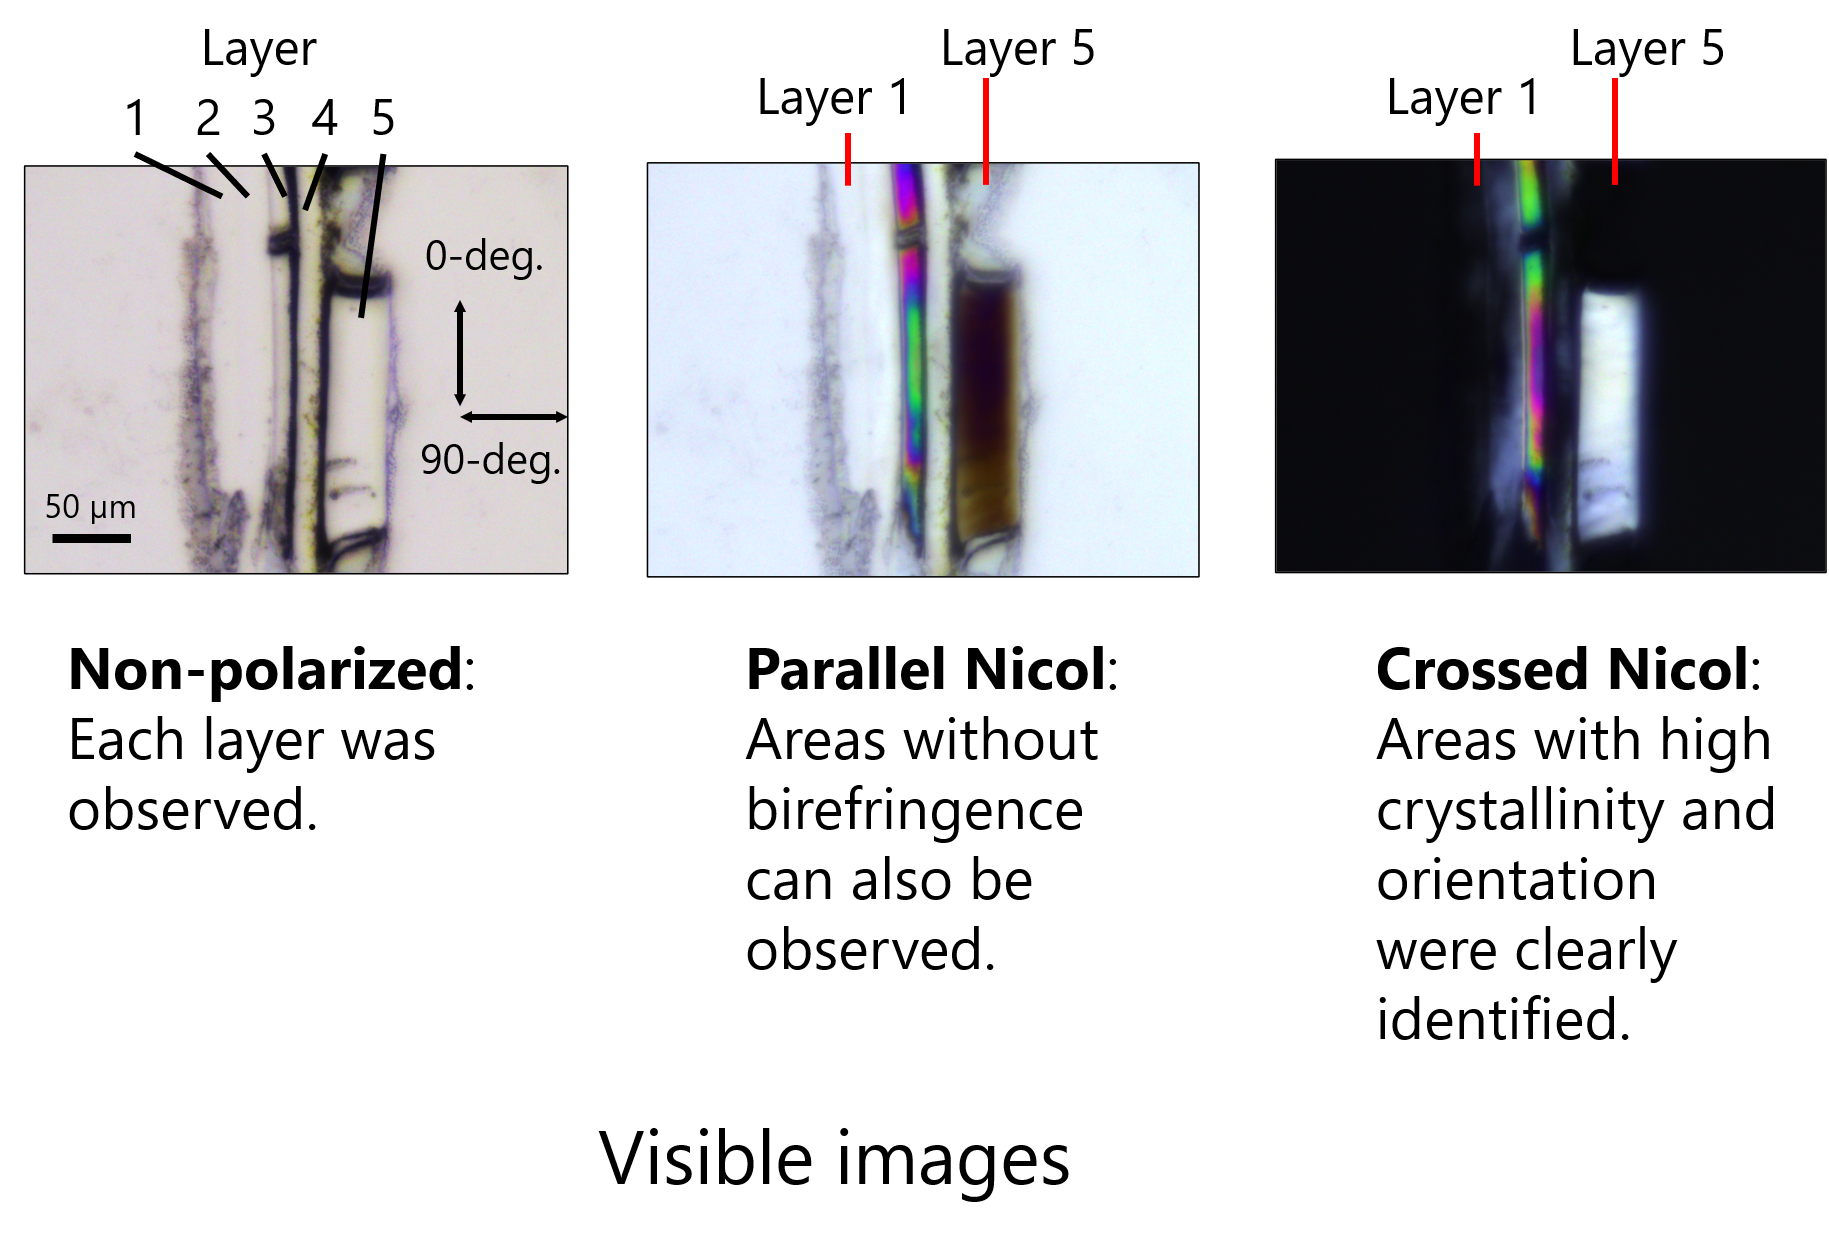
Crossed Nicol polarized visible image revealed the unique characteristics of layer 5, suggesting that its crystallinity or orientation clearly differs from other layers. It helps determine measurement points that need to be analyzed.
For more detailed analysis, polarized IR measurements were performed on layer 1 and 5, (both are polypropylene.) Layer 1 was unoriented, whereas the main chains of layer 5 were highly oriented in 0-deg. direction.
Conclusion
- We developed ‘IQ Frame’ that enables efficient orthogonal microscopic assessment.
- Orthogonal assessment of micro fabrics using UV/Vis/NIR, Raman and FT-IR microscopes with IQ Frame enabled to obtain multifaced information of polymer materials.
- Orthogonal assessment of multi-layer film using polarized visible observation and IR microscopy is effective for easier and detailed analysis of oriented and/or crystallized polymer.
References
Poster Session at 13th International Conference on Advanced Vibrational Spectroscopy (ICAVS 13, November 30 – December 5, 2025, in Xiamen, China)
Kohei TAMURA, Shingo NORIMOTO, Yuji HIGUCHI, Kento AIZAWA, Masaru SHIMIZU, Satoko SUZUKI, Kenichi AKAO
JASCO Corporation, 2967-5 Ishikawa-machi, Hachioji, Tokyo, 192-8537, JAPAN


 spectrometer")