Introduction
The change in the protein’s CD spectrum reflects precisely the change in protein structure. The absorption derived from peptide bonds is seen in a shorter wavelength region than 240 nm. Therefore, by measuring the CD spectra in such wavelength region, the information regarding secondary structure of proteins can be acquired. On the other hand, absorption due to side chains such as aromatic amino acids exists in the region of 210-220 nm, while there are absorption bands in the longer-wavelength regions (which does not overlap with the absorption band of peptide bonds) than 240 nm as well. For this reason, in order to study side chains, a CD spectrum in the longer-wavelength region than 240 nm, which does not overlap the absorption of peptide bonds, is usually measured.
In this application, as an example, the interactions between lysozyme and its inhibitor, N-acetyl-(D+)-glucosamine (NAG), were measured by using the J-1500 Circular Dichroism spectrometer.
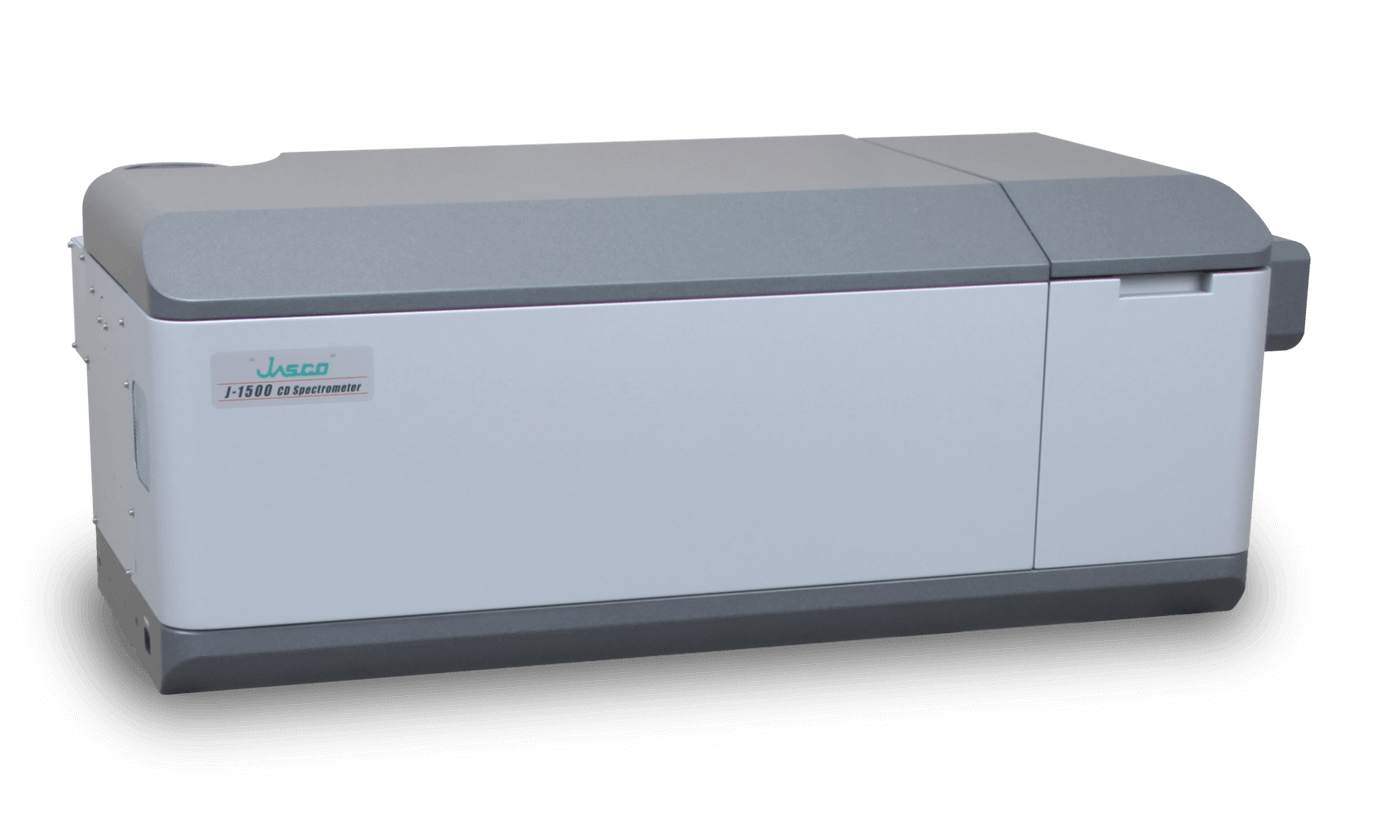
J-1500 Circular Dichroism spectrometer
Experimental
While performing titration of NAG into Lysozyme water solution (0.07 mM), CD spectra in the region of 260-320 nm were obtained.
NAG (225 mM) with 0.05 ml increment was titrated slowly by utilizing the ATS-530 Automatic Titration System. Furthermore, measurement was implemented by using 10 mm cells, maintaining a temperature at 20 ºC through the Peltier type constant temperature cell holder.
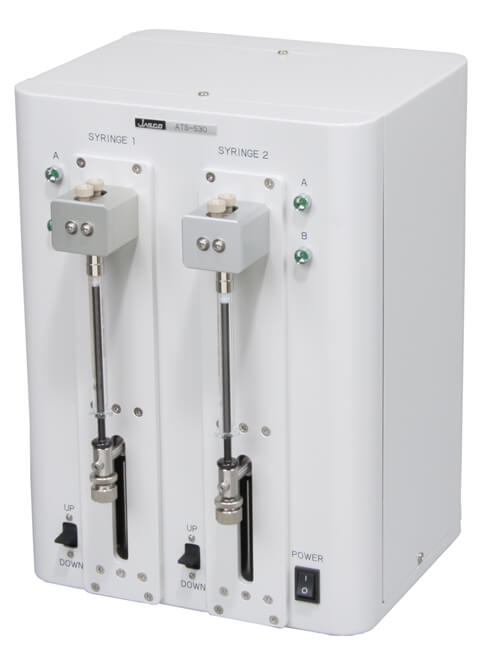
ATS-530 Automatic Titration System
Number of Syringe: 2
Volume of Syringe: 2.5 ml
Results
The CD spectra of lysozyme, lysozyme+NAG, and NAG are shown in Figure 1. The CD peaks of lysozyme in water solution were positive at 293.5 nm, 289 nm and 283.2 nm. By adding NAG, an increase of CD intensity in the region of 300-270 nm was observed, while in this wavelength region, the CD due to NAG was scarcely observed.
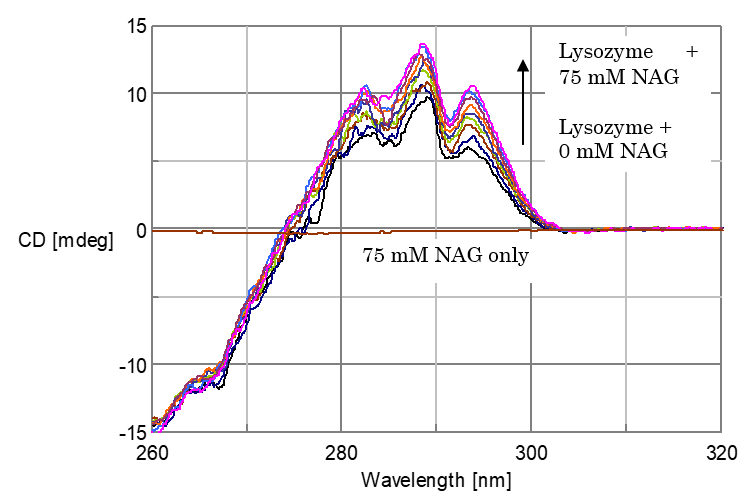
Figure 1. CD Spectra of Lysozyme, Lysozyme+NAG, NAG
In Figure 2 (left), the change of CD spectra using NAG titration is shown using a bird’s-eye view; in Figure 2 (right), the change of CD intensity at 293.5 nm is shown.
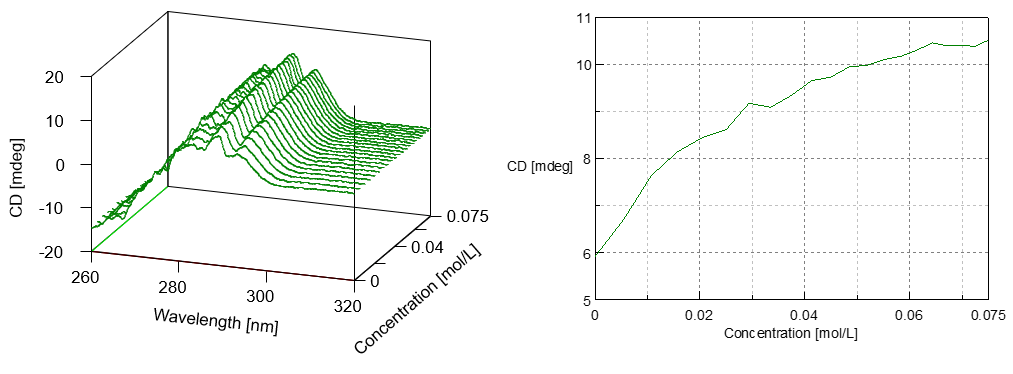
Figure 2. Change in CD Spectra using NAG Titration (left) and Change in CD value at 293.5 nm by NAG Titration (right)
According to the result by the X-ray analysis, it is evident that in the substrate bond region of lysozyme there exists triptophan residue. From this, it can be interpretted that the increase in CD intensity is due to the interaction of triptophan residue and NAG.
Conclusion
By conducting such CD measurements, the change in condition of the side chain of enzyme molecules during interactions between an enzyme and substrate can be recognized, and when the substrate bond region is known, the type of CD-related side chain can be estimated.