
Introduction
We have previously worked on Raman monitoring in flow systems, including the flow synthesis of pharmaceuticals. Raman spectroscopy is well suited for in-situ and online measurements because spectra can be acquired directly during the process. However, it suffers from low sensitivity due to the inherently weak nature of Raman scattering light. At the RSC-JAIMA Symposium 2024, we reported a flow monitoring system using surface-enhanced Raman scattering (SERS), which achieved enhanced sensitivity [1]. Nevertheless, challenges remained regarding quantification and the durability of the substrate for repeated use.
To overcome these issues, this study investigated high-sensitivity flow measurements using the vertical flow (VF) method as a new approach for sensitivity enhancement [2].
About VF method
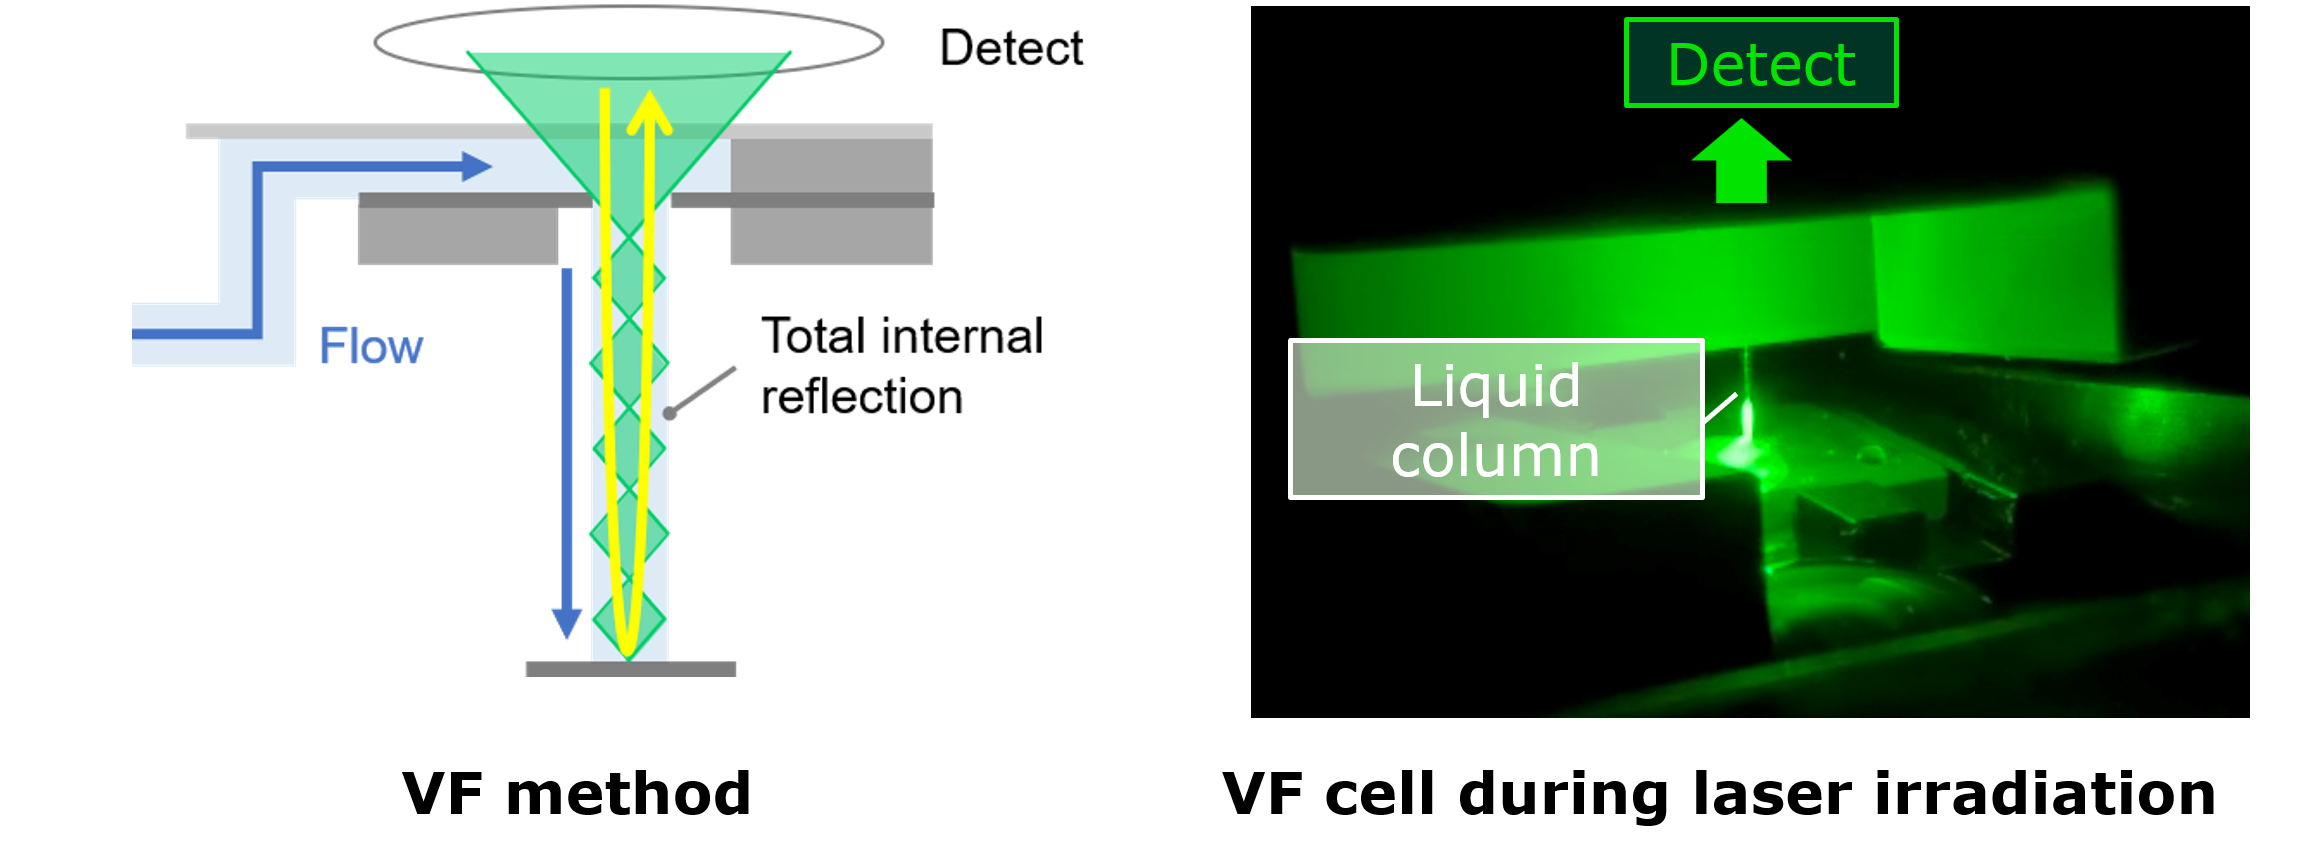
The VF method, developed by Hiramatsu et al.[3], utilizes total internal reflection at the gas–liquid interface to confine light and enhance the collection efficiency of scattered light. In this study, a VF cell was fabricated, and its enhancement effect was evaluated.
Experimental
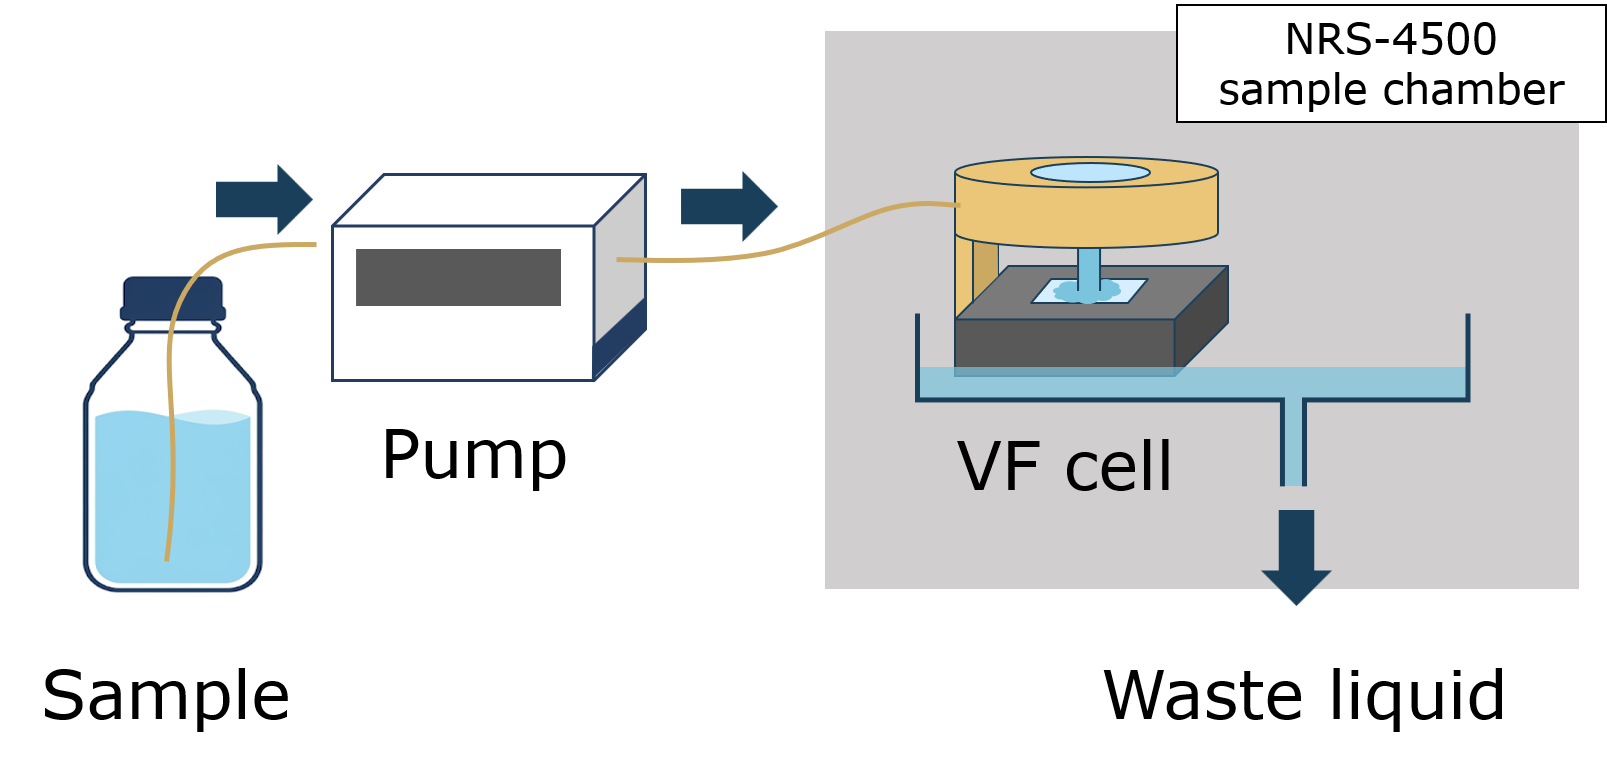
Flow diagram
Sample
Solute: Methyl 4-hydroxybenzoate (MP)
Solvent: Acetonitrile + water (1:1)
Solution concentration: 0 wt%, 0.01 wt%, 0.05 wt%, 0.1 wt%, 0.5 wt%, 2 wt%

Measurement conditions
Excitation wavelength: 532 nm
Objective lens: 50× (N.A. 0.5)
Laser power: 80 mW
Exposure time: 5 msec
Flow rate: 3 mL/min
Measurements were performed at 0.22 sec intervals with a single accumulation per measurement. The acquired spectra were subsequently accumulated as needed.
Results
Evaluation of Signal Enhancement
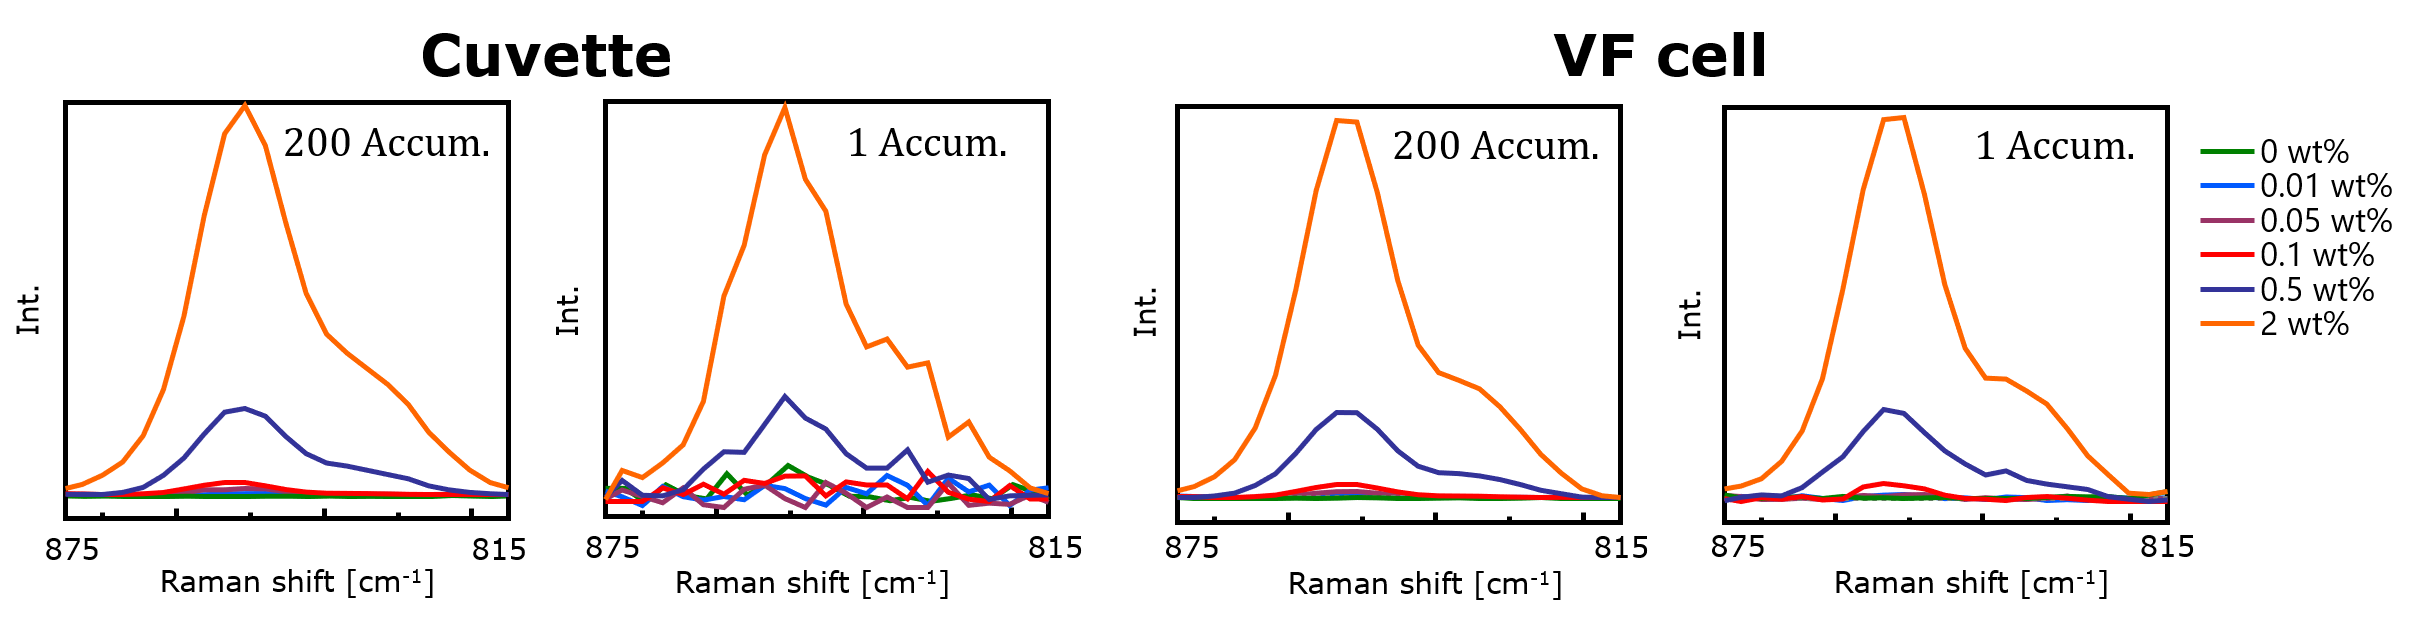
The VF cell and conventional cuvette were compared using a 2 wt% MP solution under identical measurement conditions with 200 accumulations.
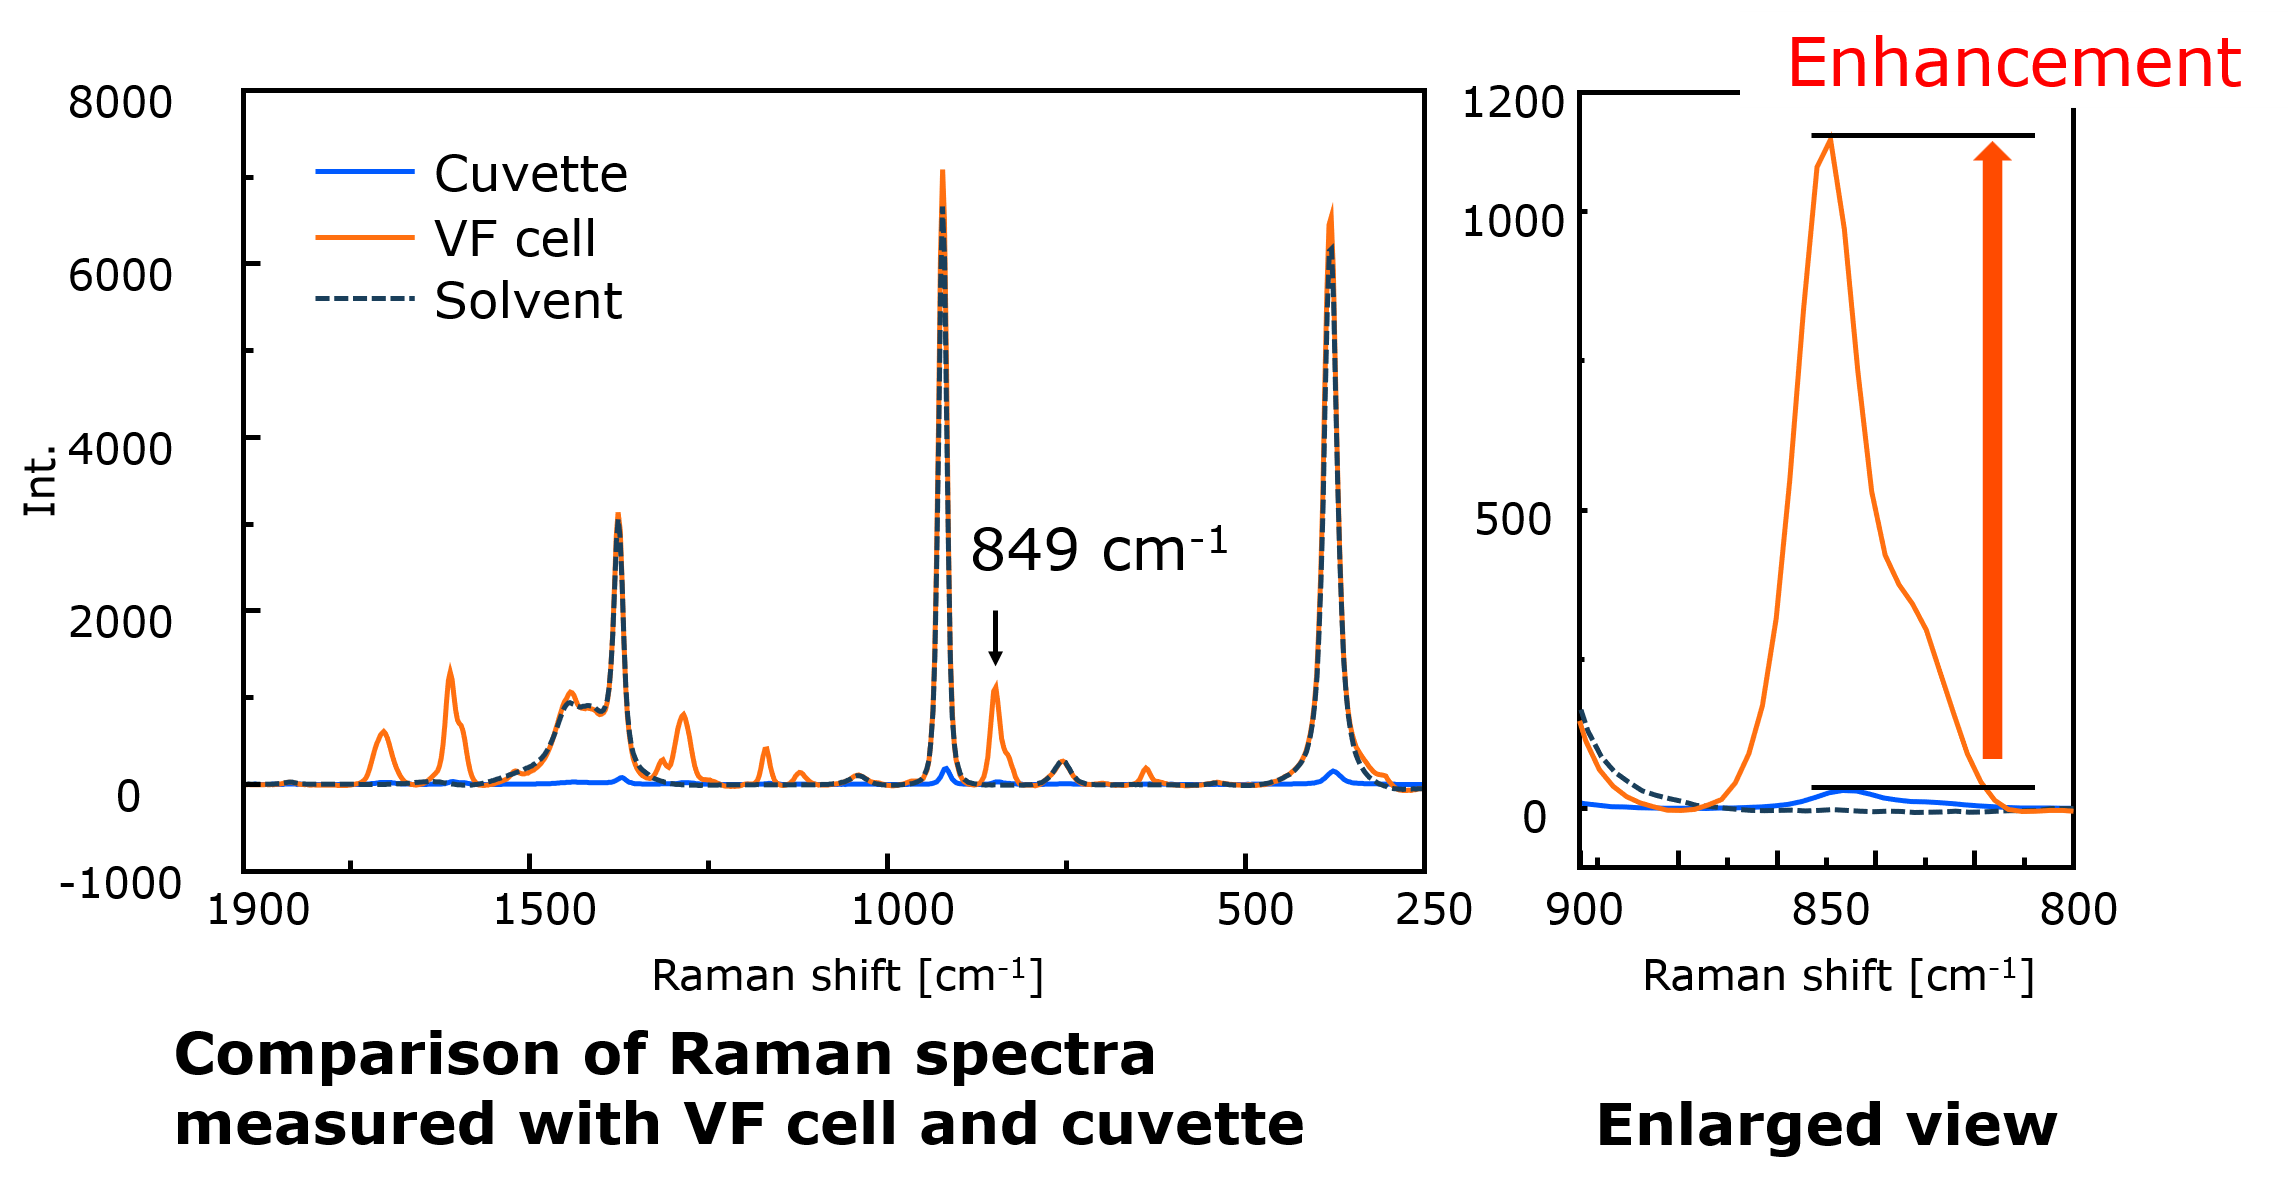
The peak height for the solute-specific band at 849 cm-1 was approximately 38 times higher, confirming a remarkable improvement in sensitivity.
Dependence on number of accumulations
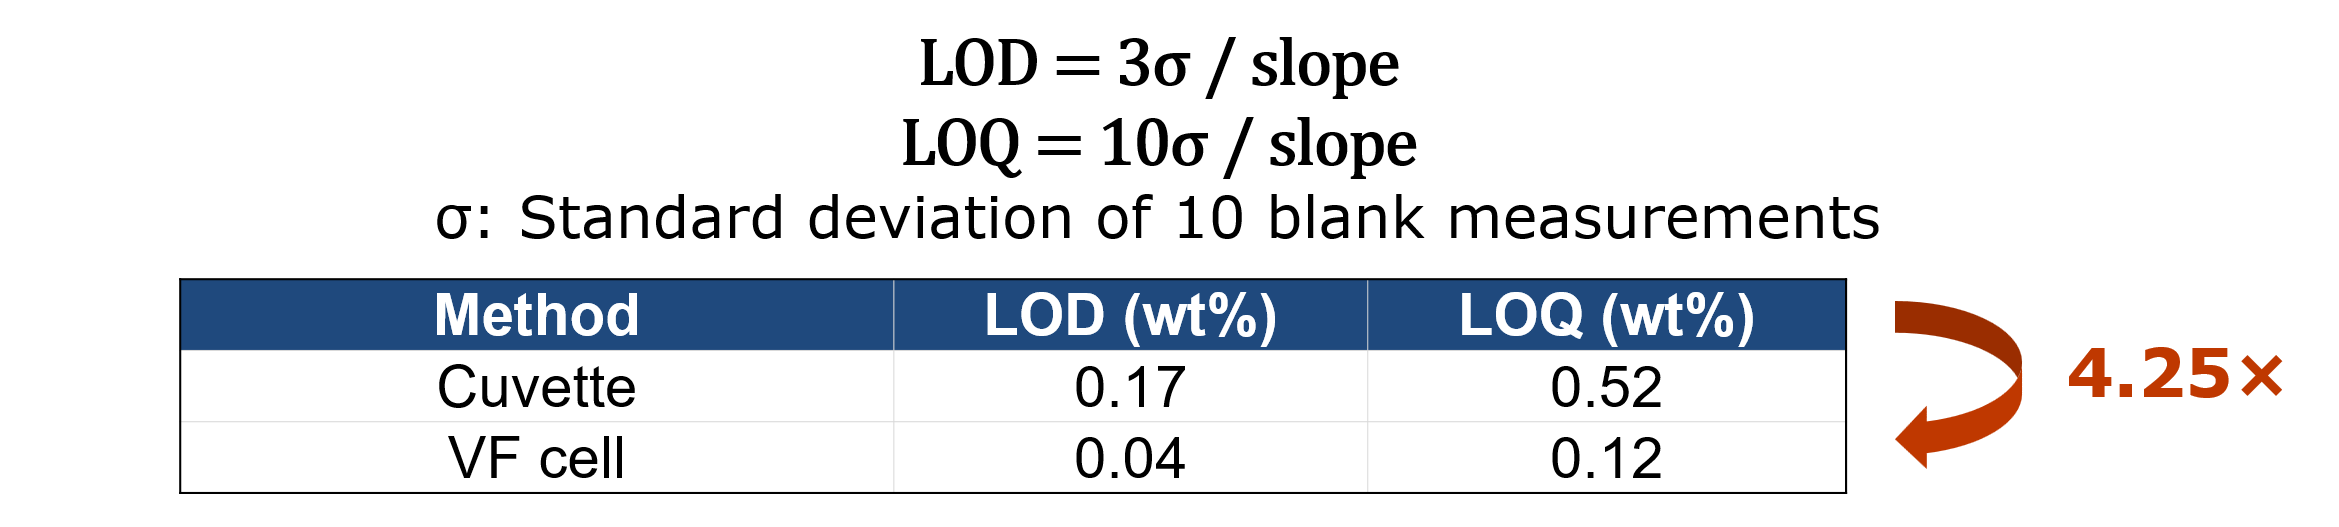
The results obtained with 200 accumulations (adequate S/N) and a single accumulation were compared. Calibration curves were constructed over the range of 0 wt% – 0.5 wt% for each condition, and R², the limit of detection (LOD) , and the limit of quantification (LOQ) were calculated.
Raman spectra
Calibration curves
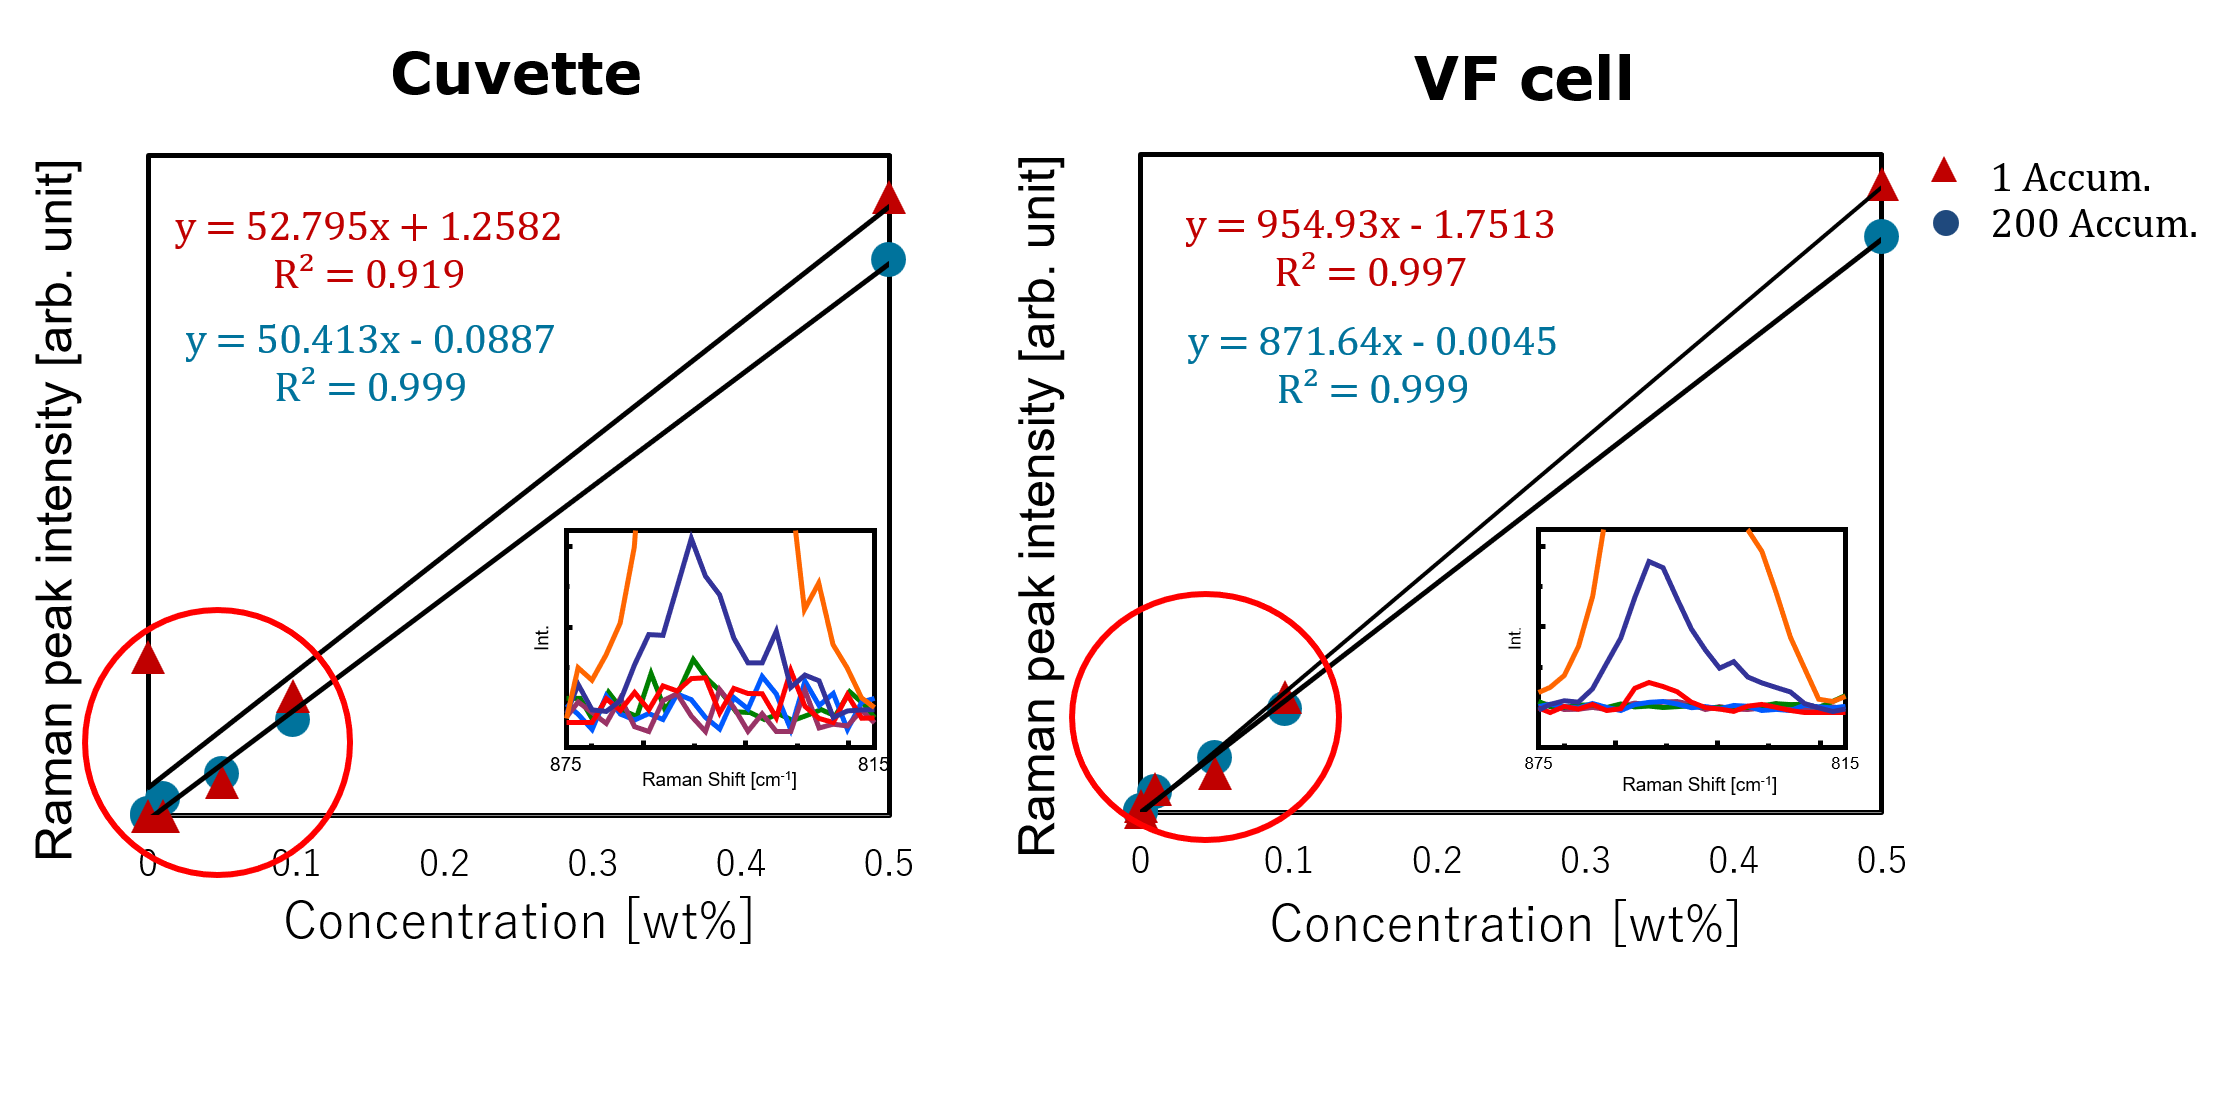
- For 200 accumulations, both cells exhibited good linearity of the calibration curves.
- For a single accumulation, the cuvette method exhibited reduced linearity in the low-concentration range.
Calculation of LOD and LOQ
Time-dependent changes
The sample concentration was continuously changed (0 wt% → 0.01 wt% and 0.5 wt% → 2 wt%). Assuming a flow-monitoring system, changes in the solute and solvent peak intensities were monitored. Peak intensity ratios were calculated from both the raw data and data denoised by principal component analysis (PCA) using 20 principal components from all 1,400 measured points.
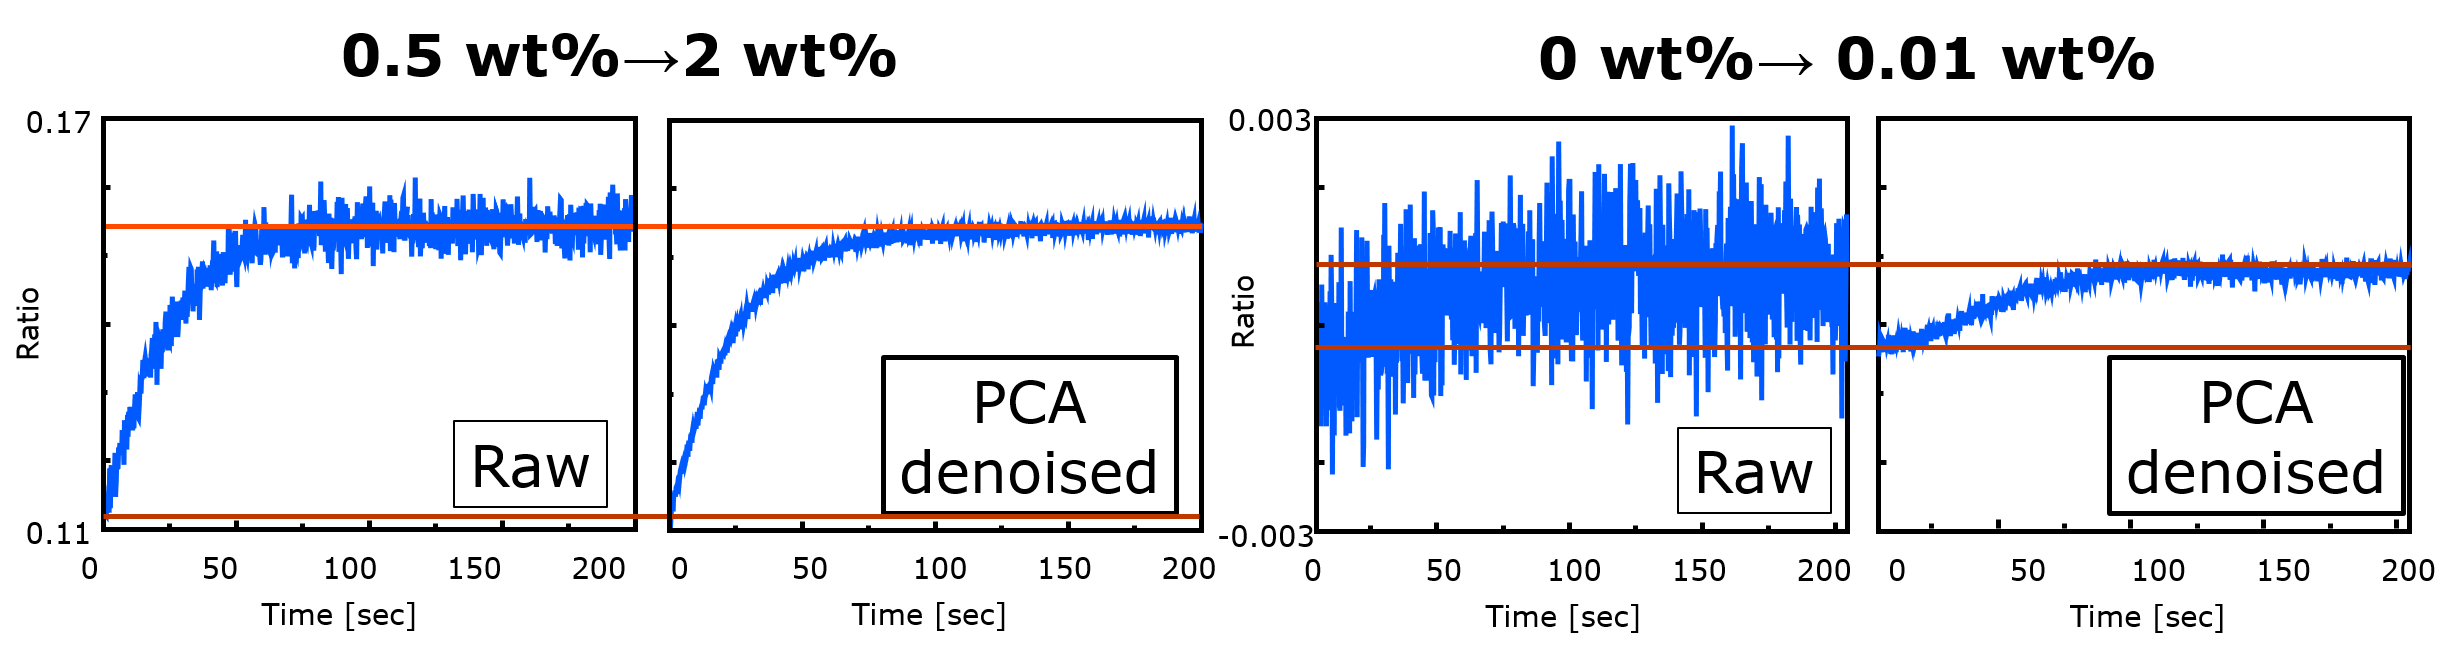
The raw data exhibited substantial noise, whereas changes were detectable even at 0.01 wt% after PCA denoising.
These results suggest that changes in samples at extremely low concentrations may be monitored by combining peak intensity ratios from the raw data with data processing techniques such as PCA denoising.
Conclusion
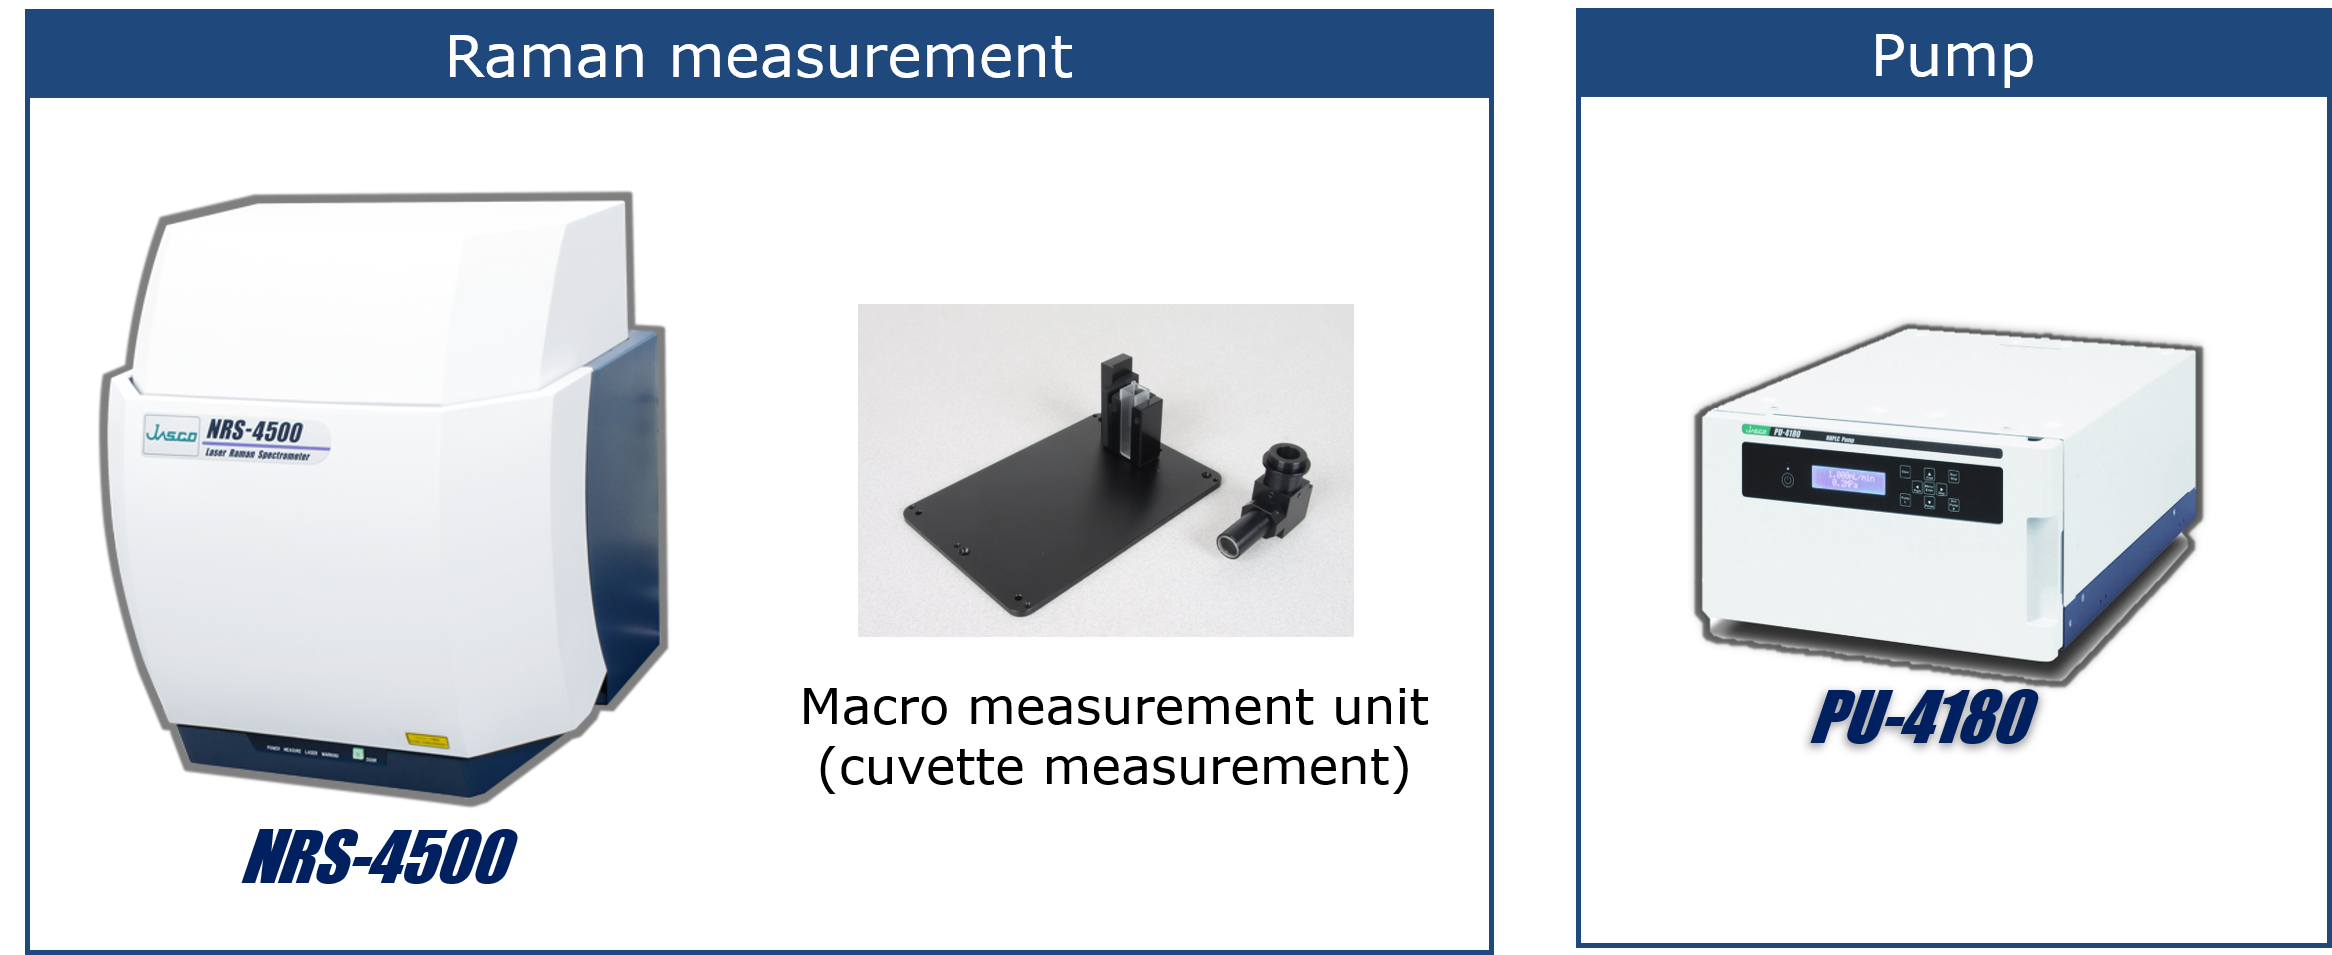
- The VF method was integrated into a commercially available NRS-4500 Raman microscope, and its signal enhancement effect was confirmed.
- With a 5-msec exposure and a single accumulation, the VF cell improved both the LOD and LOQ by a factor of 4.25
- By combining noise reduction, changes in peak intensity could be detected even for a 0.01 wt% solution.
References
Poster Session at RSC-JAIMA Symposium on Analytical Chemistry 2026 (September 3 – 4, 2026, in Makuhari Messe, JAPAN)
Sarina Mine1, Koji Inada2, Takayoshi Ota2, Kohei Tamura1, Satoe Iijima1, Ken-ichi Akao1, Hirotsugu Hiramatsu3
1 JASCO Corporation, 2 JASCO Engineering, 3Department of Applied Chemistry, National Yang Ming Chiao Tung University
[1] S. Mine, et al. “Development of a monitoring system using Raman spectroscopy for the flow synthesis process” Poster presented at: RSC-JAIMA Symposium on Analytical Chemistry 2024, September 2024, Chiba.
[2] Y-S. Chen, H. Hiramatsu, Anal. Chem., 97, 25, 12981–12988 (2025).
[3] H. Hiramatsu, T. Saito, J. Raman Spectrosc., 45, 2, 208-210 (2014).
Related Posts:
 Reaction Monitoring System using Surface-Enhanced…
 In-situ Raman Monitoring for Flow Synthesis of Peptide Drugs
 Highly efficient spectral measurement methods using…
 Estimation of Optimal Excitation Wavelength for…
 Avoiding Interference from Fluorescence Signal by…
 Vibrational Circular Dichroism Spectrometer based on…