
Introduction
< Key Points >
– Evaluation of polycarbonate (PC) degradation is important for developing products made from PC and controlling their quality.
– GPC enables calculation of the molecular weight distribution for degraded PC samples.
Polycarbonate (PC) is a polymer commonly used in electronic devices and construction materials. PC undergoes degradation due to factors such as exposure to ultraviolet light or heat and repeated recycling. Quantitatively evaluating the associated changes in physical properties is important for developing products made from PC and controlling their quality. One method for performing such evaluations of polymer raw materials involves the use of gel permeation chromatography (GPC) to determine their molecular weight distribution. When analyzing PC by GPC, tetrahydrofuran (THF) is typically used as an eluent.
In this study, we investigated the degradation of PC test samples caused by irradiation in a xenon accelerated weathering tester. Changes in the molecular weight distribution were evaluated using a GPC system equipped with a refractive index detector (RI-4030) and a high-performance analytical GPC column. For data analysis, we used the molecular weight distribution calculation program in ChromNAV. We created a molecular weight calibration curve using polystyrene (PS) standard samples and then calculated the molecular weight distribution for degraded PC samples.
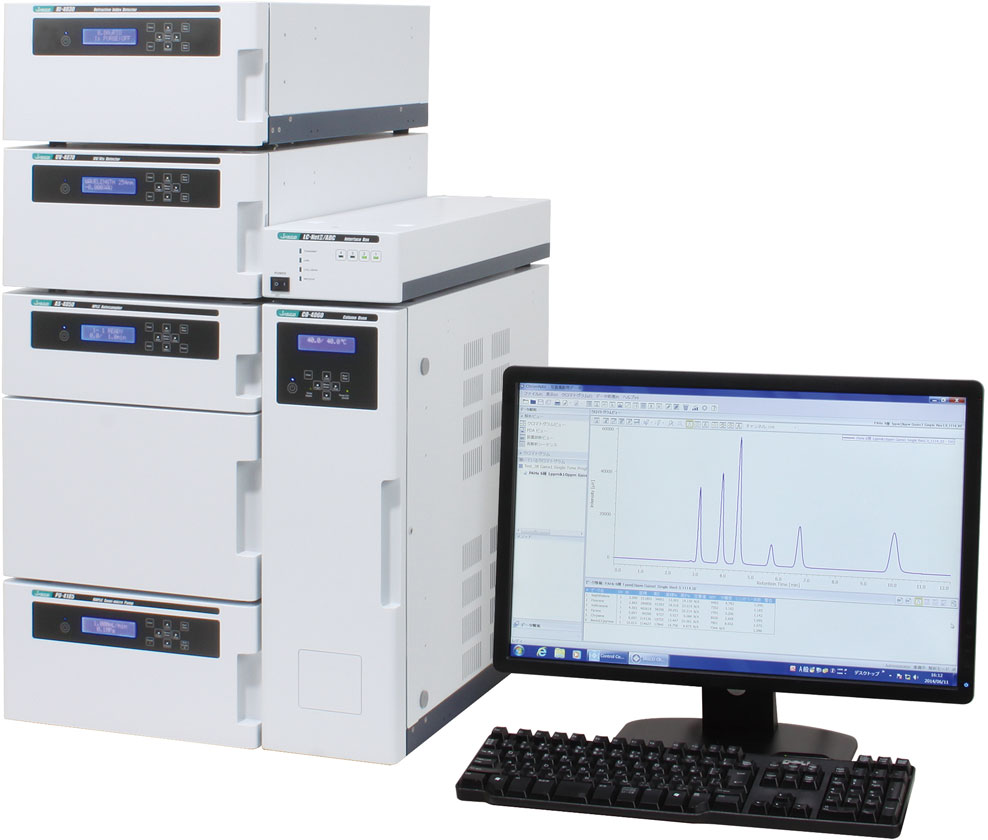
LC-4000 GPC system
Experimental
LC system
Pump: PU-4180*
Autosampler: AS-4150
Column oven: CO-4060
Detector: RI-4030
* with option units
LC conditions
Column: GPC KF-806L x 2 (8.0 mmI.D. x 300 mmL, 10 µm)
Eluent: THF (stabilizer-free)
Flow rate: 1.0 mL/min
Column temp.: 40 ºC
Injection volume: 100 µL
Sample
<Standard samples for creating molecular weight calibration curve>
– PS mixed sample (two samples were prepared for different molecular weight peaks (Mp))
– Standard sample 1: Mp 1470000, 257000, 18100, 3090
– Standard sample 2: Mp 778000, 64500, 6320
(Each sample was dissolved and diluted in THF to 0.025 % (w/v))
<Test samples for evaluation>
PC test samples (approx. 3 mm, pellet-shaped, Standard Test Piece Co., Ltd.)
Structure

PC
Keywords
PC, polycarbonate, GPC, molecular weight distribution, molecular weight calibration curve, THF, RI detector
Results
Figure 1 shows the procedure used for the photodegradation test. For light irradiation, a xenon accelerated weathering tester (SOLARBOX 1500e, manufactured by Cofomegra, provided by JASCO INTERNATIONAL Co., Ltd.) was used, with irradiation performed at an irradiance of 60 W/m² and a temperature of 65 ºC. Three test samples were sequentially inserted into the weathering tester at different times to give total irradiation times of 10 days, 5 days, and 1 day for Samples 1, 2, and 3, respectively. After irradiation was completed, to measure the degraded layer of the test samples using GPC, a plane slicer (Slice Master KS-10, provided by JASCO Engineering Co., Ltd.) was used to remove the degraded layer from the irradiated surface of the test samples. The portions of the surface degradation layer were dissolved in THF to a concentration of 0.1% (w/v) for GPC measurement.

Fig. 1 Photodegradation test procedure
Figure 2 shows chromatograms for two PS samples (standard samples 1 and 2), and Figure 3 shows the resulting calibration curve.
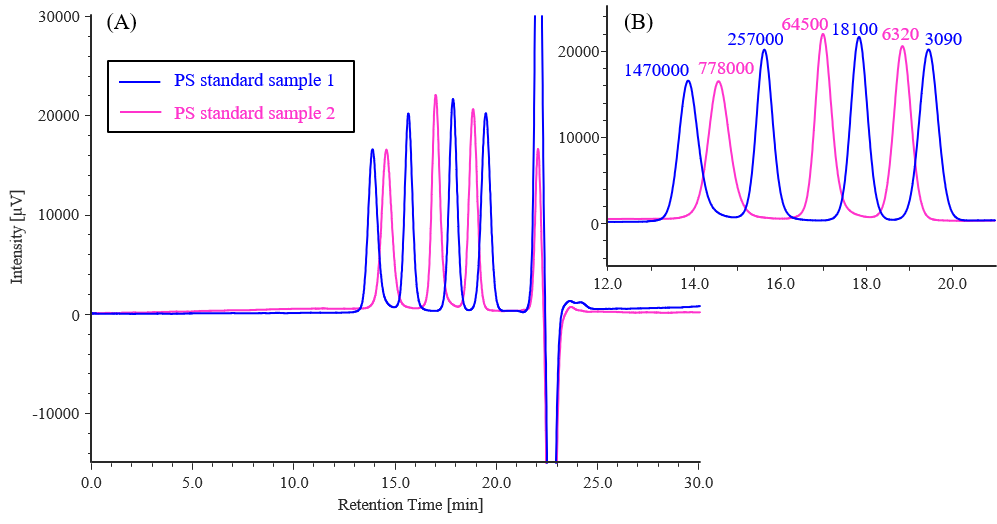
Fig. 2 Chromatograms for PS standard samples
(A) Full curves (B) Enlarged view of peaks
(The values above the peaks represent the Mp for the PS standard samples.)
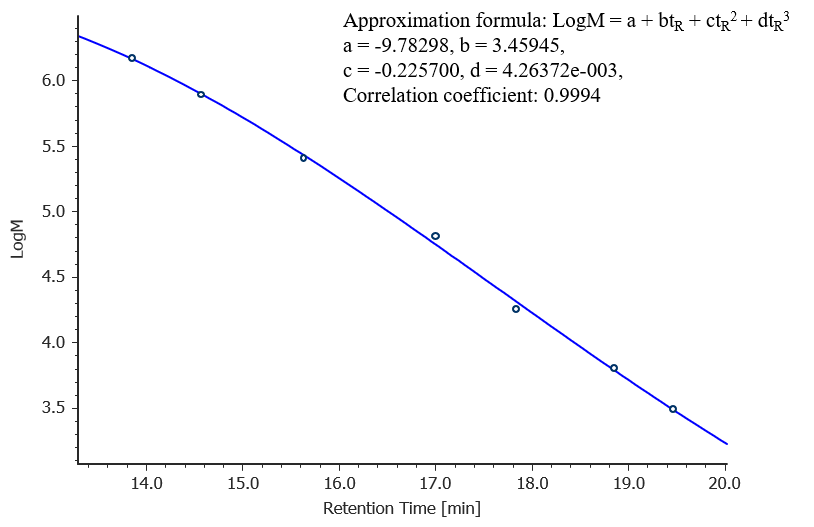
Fig. 3 Molecular weight calibration curve created using PS standard samples
Figure 4 shows chromatograms for the PC samples subjected to photodegradation testing, together with that for an unirradiated sample. Figure 5 shows the corresponding differential molecular weight distribution curves, where the horizontal axis represents the logarithm of the molecular weight to make it easier to observe changes in the distribution. It can be seen that the distribution shifts towards a slightly higher molecular weight as the irradiation time increases.
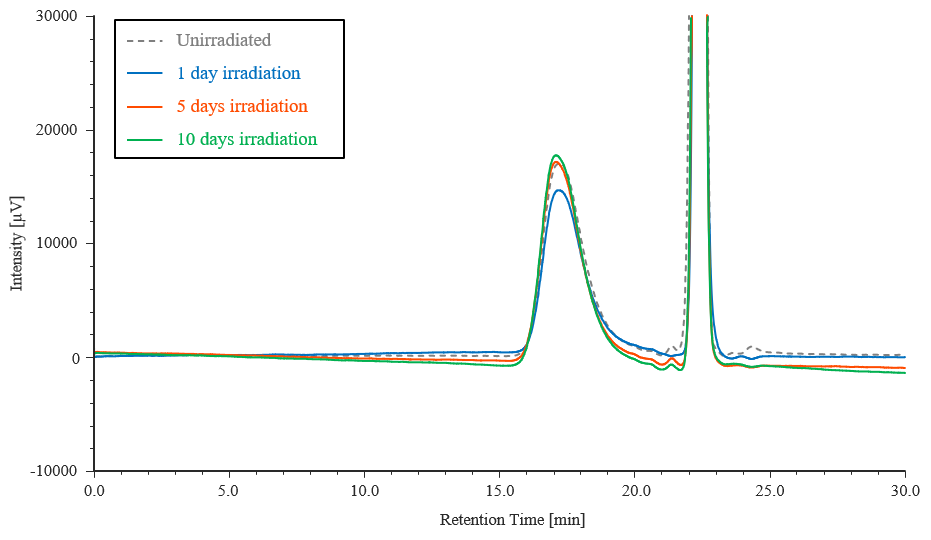
Fig. 4 Chromatograms for PC test samples
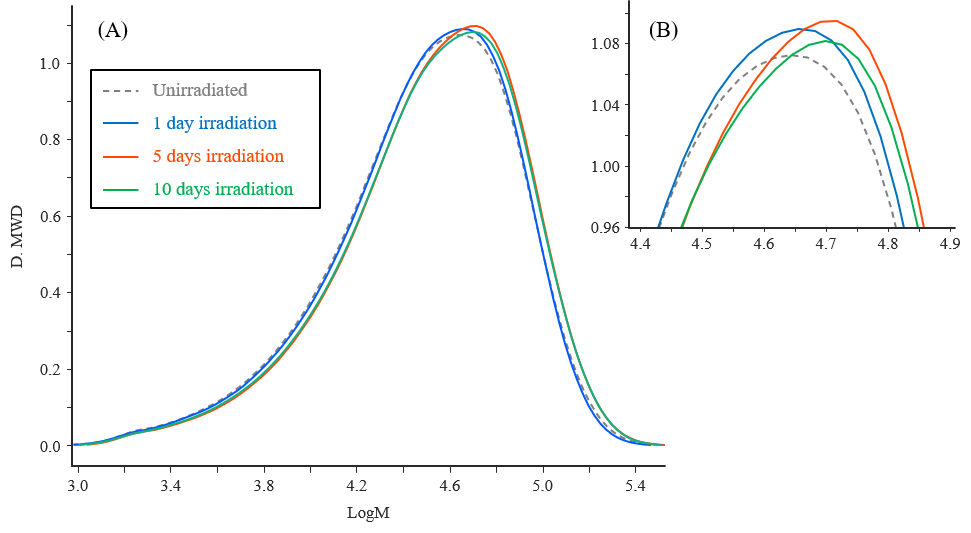
Fig. 5 Differential molecular weight distribution curves for PC test samples
(A) Full curves (B) Enlarged view of peak top
Table 1 shows the PS equivalent average molecular weight calculation results, and Figure 6 shows the changes in the number-average molecular weight (Mn) and weight-average molecular weight (Mw) with irradiation time. From 1 day to 5 days of irradiation, Mp, Mw and Mn increased, suggesting that intermolecular condensation and cross-linking occur upon light irradiation1.
Table 1 Average molecular weight calculation results for PC test samples
| Sample | Mp | Mn | Mw | Mw/Mn |
| Unirradiated | 43626 | 18907 | 42653 | 2.26 |
| 1 day irradiation | 44953 | 19108 | 42578 | 2.23 |
| 5 day irradiation | 50165 | 20744 | 46311 | 2.24 |
| 10 day irradiation | 49175 | 20265 | 45854 | 2.27 |

Fig. 6 Change in average molecular weight with irradiation time
(A) Number-average molecular weight (Mn) (B) Weight-average molecular weight (Mw)
Conclusion
In this study, we investigated the degree of photodegradation of PC test samples following irradiation in a xenon accelerated weathering tester. The molecular weight distribution was determined using a GPC system. From 1 day to 5 days of irradiation, Mp, Mw and Mn increased, suggesting that the intermolecular condensation and cross-linking occur upon light irradiation. These measurements can be utilized for the quantitative evaluation of resin degradation.
References
1.SABIC Innovative Plastics IP B.V: J. F. Morizur, P. D. Sybert, US 20140178665A1, “Cross-linked polycarbonate resin with improved chemical and flame resistance” (2014.6.26).
Related Posts:
 Evaluation of Degradation of PET by Molecular Weight…
 Evaluation of Degradation of POM by Molecular Weight…
 Evaluation of Degradation of PA6 by Molecular Weight…
 Evaluation of Polystyrene (PS) Degradation by…
 Monitoring of Aggregates and Degradation Products by…
 Efficient Evaluation of Substituent Effects in…